
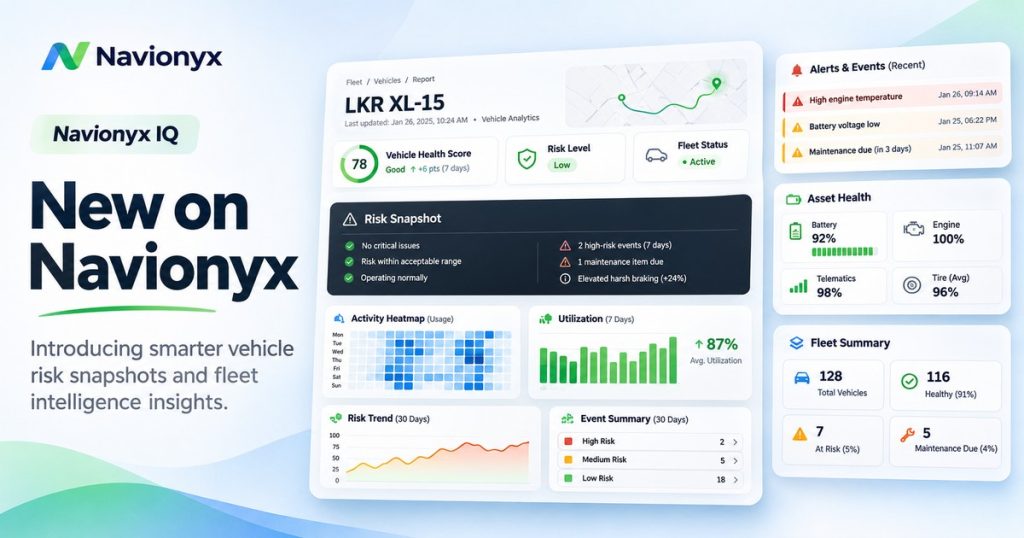
EV Fleet Intelligence · Navionyx IQ
GPS tells you where a vehicle is. Navionyx IQ tells you whether that vehicle is behaving like itself, and shows you the evidence behind every number.
By Navionyx Team · November 2026 · 9 min read

An electric three wheeler that runs 138 km a day, almost every day, for nine months looks like a perfect asset on a tracking map. It is moving. It is earning. The battery is being used hard. So why did our analysis flag it for a phone call to the owner?
This article walks through a real Navionyx IQ vehicle report, section by section, for one electric L5 passenger three wheeler observed across 267 days. We will show what the report reads from the vehicle, how it builds a baseline that belongs to that vehicle alone, what it found about driving behaviour, usage and battery load, and why the single most important finding had nothing to do with speed. If you run an EV fleet, finance electric vehicles or build an EV product, this is what EV fleet behaviour analytics looks like when every number can be checked.
The vehicle in this report is a real vehicle on the Navionyx platform. Registration, owner, lender and exact locations have been removed. Figures are shown as they appeared in the report dated 25 October 2026.
Why tracking alone does not answer the questions EV fleets actually ask
A live map answers one question: where is the vehicle right now. Fleet heads, lenders and EV makers ask different questions. Is this vehicle working as much as it did last quarter? Is it being driven in a way that will shorten its battery life? Has it started going somewhere new? Did the device go quiet during hours when the vehicle is normally on the road?
Most systems try to answer these with fixed rules. Someone sets a shift from 8 in the morning to 6 in the evening, a speed limit and a geofence, and the software reports anything outside those settings. That approach fails in two directions. It raises alarms for routines that are perfectly normal for a given vehicle, and it stays silent on genuine surprises nobody thought to write a rule for.
We built Navionyx IQ to solve exactly this. It is the analysis layer behind every behavioural insight on the Navionyx platform, and it compares each vehicle only against its own history.
What Navionyx IQ is, in one paragraph
Navionyx IQ reads the telemetry a vehicle already sends, cleans it, splits it into trips and stops, reduces each day into one compact summary, and builds a rolling baseline of roughly 90 days for that vehicle. It then compares recent days against that baseline. When something departs from the vehicle’s own normal, it records an event with three things attached: what was observed, the baseline it departed from, and how far it departed. No extra hardware is needed for the behavioural analysis, it runs on Navionyx infrastructure in India, and no customer data is sent to any third party AI service.
The five stages behind every Navionyx IQ report
1. Normalise. Remove impossible positions, duplicates and readings that could not physically happen.
2. Segment. Turn clean positions into real trips and real stops.
3. Summarise. Reduce each vehicle day into one summary that is computed once.
4. Profile. Build a rolling 90 day baseline: duty windows, territory, speed pattern and a stability score.
5. Compare. Check recent days against that baseline and record events with evidence.
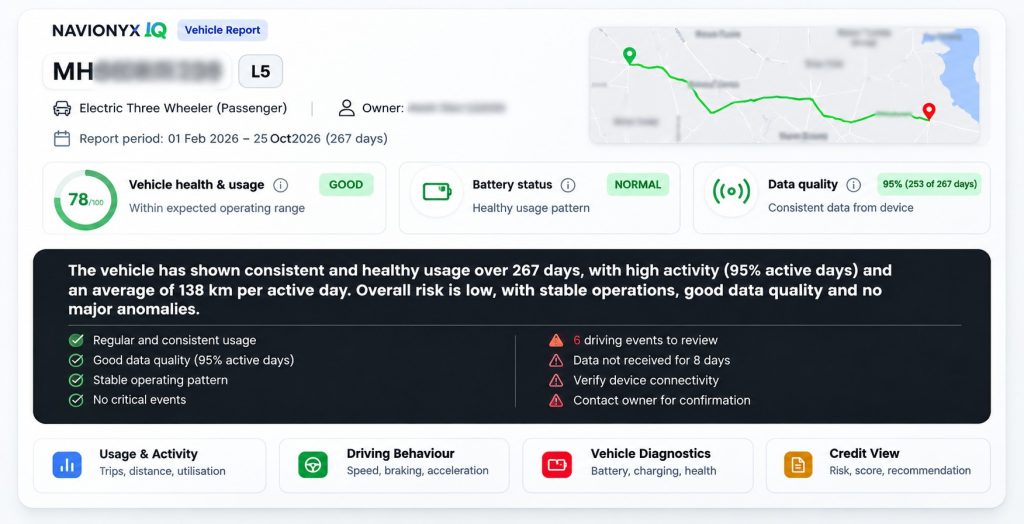
The vehicle at a glance: 267 days in four numbers
Before any scoring, the report establishes how much evidence it has. For this vehicle that evidence is substantial.
267 days observed
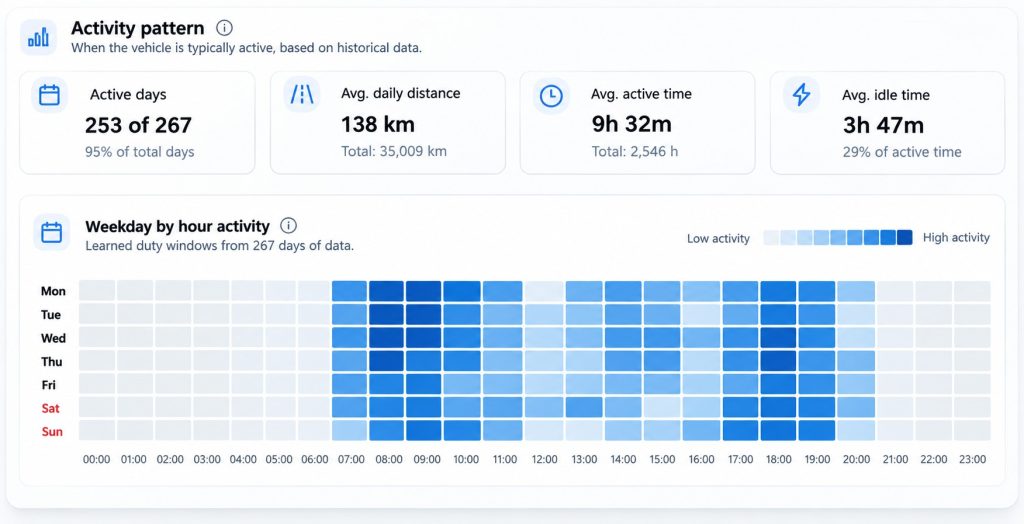
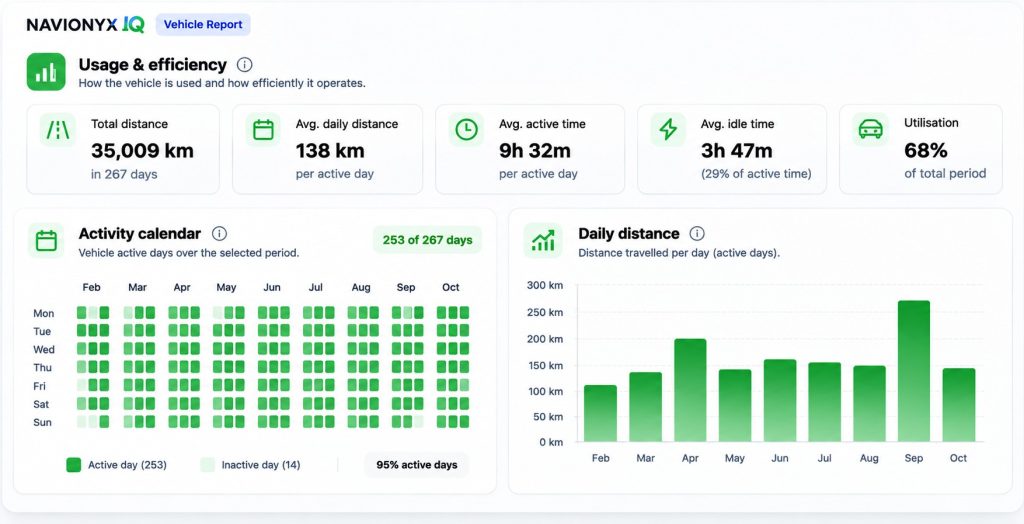
253 active days, which is 95 percent of the observed period
35,009 km total distance
138 km average per active day
For an electric three wheeler, 138 km a day is a heavy duty cycle. Depending on pack size, that usually means at least one full charge cycle every working day and often an opportunity charge in between. Over 253 days, that is a battery that has already done a large share of its rated cycle life in under a year. This is exactly why behaviour data and battery data belong in the same report.
The one page risk snapshot
Every full report can be condensed into a single page snapshot that a credit officer or fleet head can read in under a minute. Here is the snapshot for this vehicle.
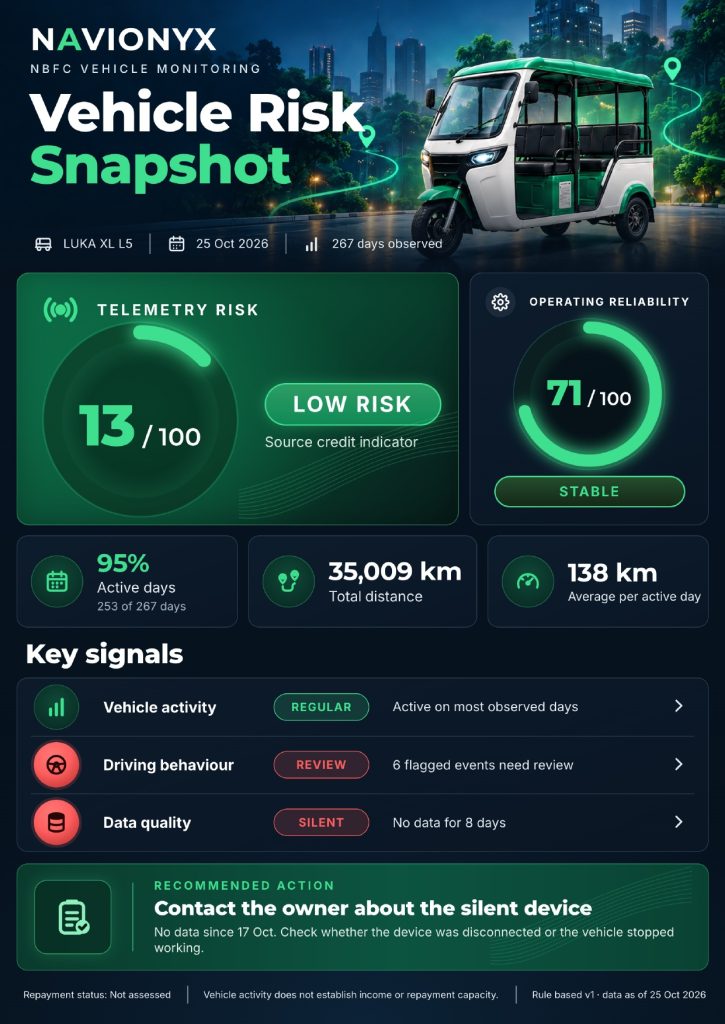
Two scores lead the page. Telemetry risk is 13 out of 100, which the report labels low risk. Operating reliability is 71 out of 100, labelled stable. Below them sit three key signals: vehicle activity is regular, driving behaviour has six flagged events that need review, and data quality is marked silent because the device has not reported for eight days.
See a real Navionyx IQ risk snapshot
Download the anonymised one page PDF used in this article.
Download the sample snapshot (PDF)Driving and behaviour: what the vehicle did, judged against itself
The driving section opens with an overall behaviour score of 78 and then breaks it down. The part that matters most is the flagged events list. Each event appears with a severity, a plain language description, and the baseline it departed from. A reader never sees a bare warning. They see an argument they can check.
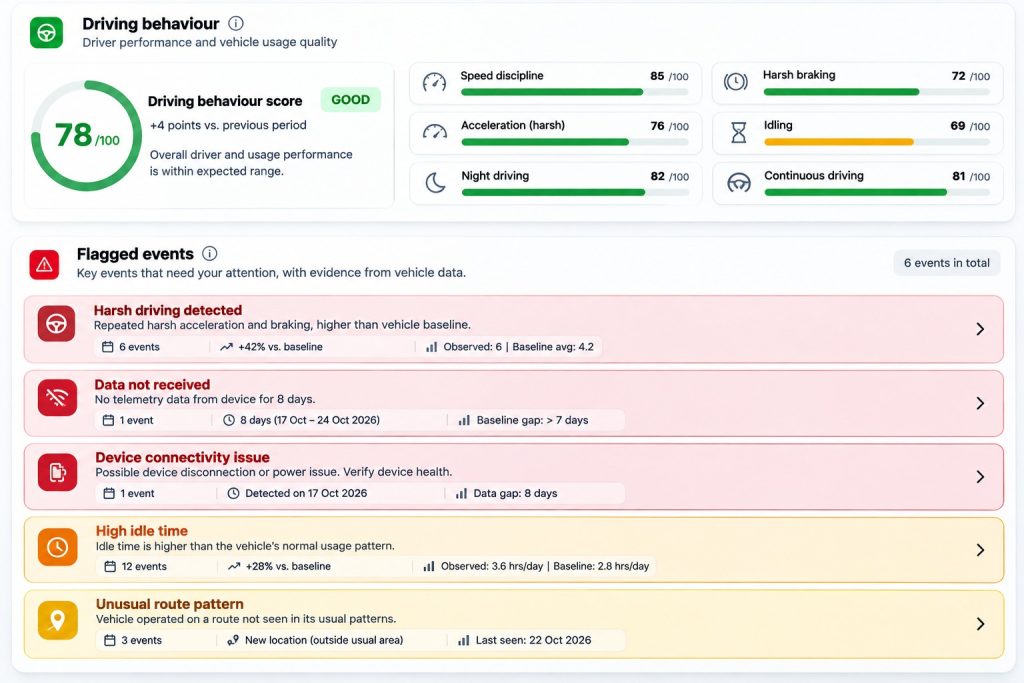
Three design choices make this section trustworthy rather than alarming.
Speed is judged against the vehicle’s own record. A loaded three wheeler and a light delivery van at the same speed are not the same event. Navionyx IQ holds each vehicle’s own speed distribution and flags departures from it, which keeps results meaningful on a mixed fleet.
Harsh braking and acceleration are labelled as inferences. When they come from position reporting rather than an accelerometer, the report says so, adjusts its confidence to the device’s reporting interval, and drops the measure entirely if the interval is too coarse to support it.
Behaviour belongs to the vehicle unless a driver is identified. Without driver login or RFID, the report describes vehicle behaviour, not a named person. Where driver assignment data exists, results are attributed accordingly.
The duty window heatmap
The weekday by hour heatmap is where the learned baseline becomes visible. Darker cells show the hours this vehicle normally works. Many commercial EVs have two legitimate duty windows, one in the morning and one in the evening. A fixed shift rule would flag the evening run every single day. Navionyx IQ recognises both windows as normal and only raises an event when movement falls outside every window the vehicle has established.
Usage and efficiency: where behaviour meets the battery
The usage section is a daily record of work. A green calendar shows every active day across the period, followed by a daily distance chart. For this vehicle the calendar is almost solid green, which matches the 95 percent active day figure. The few gaps are worth reading: scattered single rest days look like an ordinary weekly rhythm, while a block of grey at the end of the record is the silent device period we come back to below.
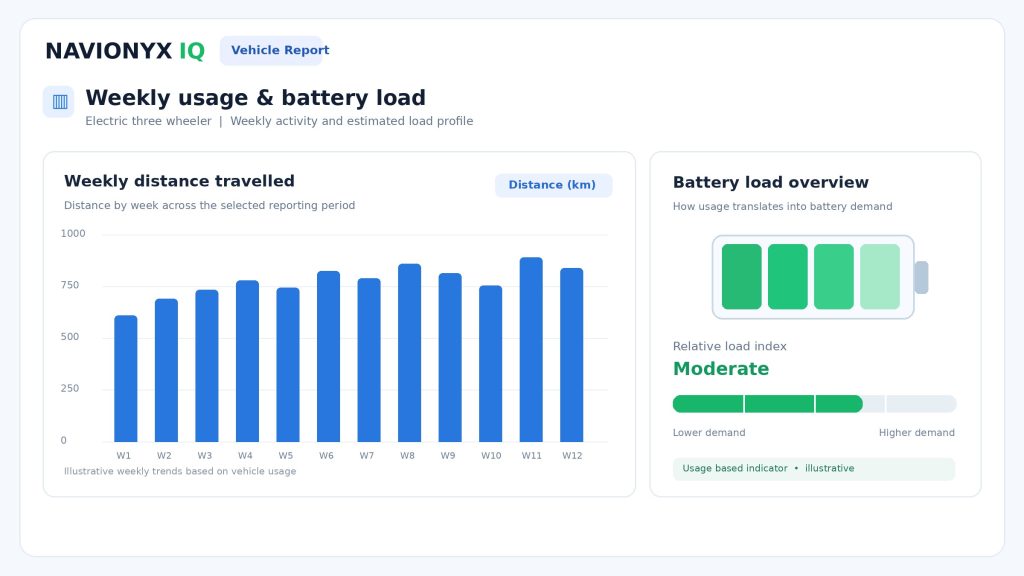
Why does this matter for an EV in particular? Because the way a vehicle is used decides how its battery ages. Consistently high daily distance means deep discharge and frequent charging. Repeated high speed running and aggressive acceleration pull high current from the pack and raise its temperature. Long idle periods at a very high or very low charge level stress the cells quietly. We covered the battery side of this in detail in Your Driving Score Is Quietly Killing Your Battery and How Charge Cycle History Predicts EV Battery Life.
A Navionyx IQ report gives that battery story its context. When a state of health figure drops faster than expected, the usage section shows whether the vehicle’s duty cycle changed, whether daily distance climbed, or whether the speed profile shifted. Where a Navionyx battery monitoring device is fitted, pack and cell data sit alongside this behaviour record, so a battery decision is made with the full picture rather than one number.
Credit view: what a lender sees, and what it deliberately does not claim
For NBFCs financing electric three wheelers, the credit view turns the same evidence into a portfolio signal. A risk trend line shows how the vehicle’s telemetry risk moved over time, a signal breakdown shows what contributed, and a dated timeline lists every event that mattered.
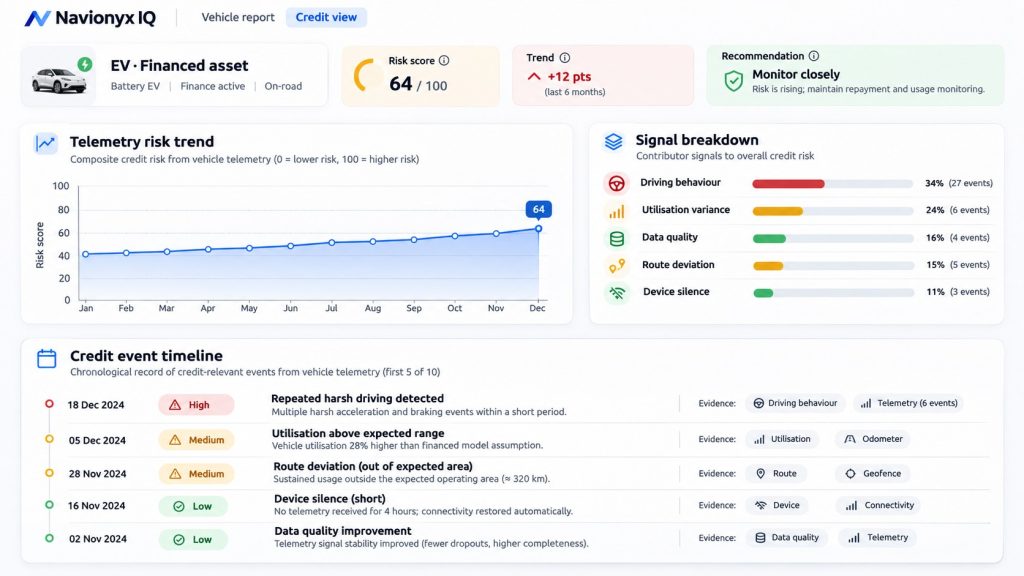
Notice the footer on the snapshot: repayment status is not assessed, and vehicle activity does not establish income or repayment capacity. We print that on every report on purpose. Telemetry describes what a vehicle did. It is strong evidence for asset monitoring and early outreach, and it should never be presented as a verdict on a borrower. If you want the lender’s playbook in full, read EV Loan Risk Management: How Telematics Helps NBFCs Protect Financed Vehicles.
Vehicle diagnostics: is the data itself healthy?
The final section checks the device and the data. Three gauges summarise reliability, reporting health and power stability, followed by detailed cards on reporting gaps, power interruptions and implausible readings that were removed before analysis. This is the least glamorous part of the report and often the most actionable, because every other number depends on it.
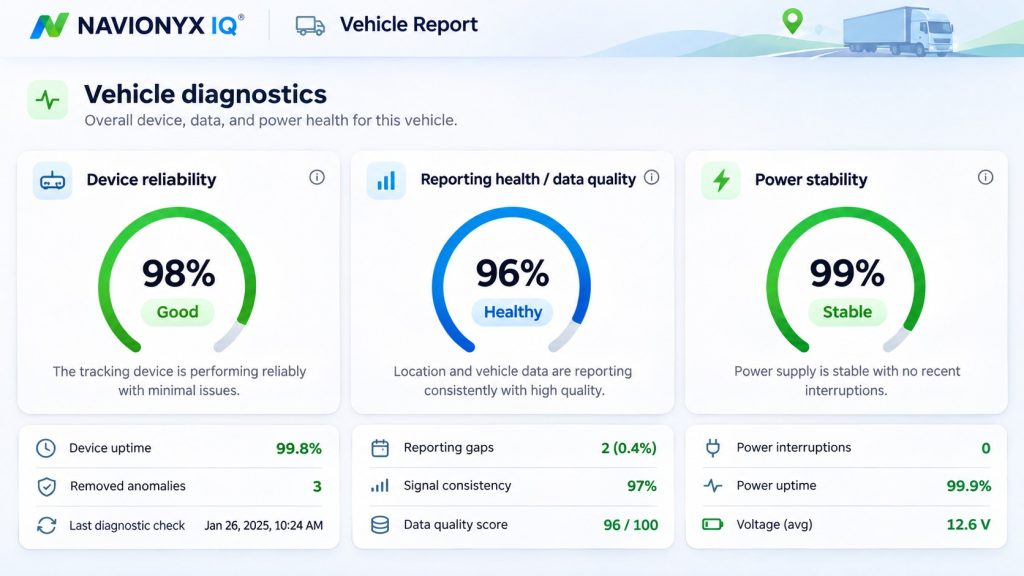
The finding that mattered most: a silent device, not a fast driver
Here is the answer to the question we opened with. On almost every measure this vehicle looks healthy: low telemetry risk, stable reliability, 95 percent active days, a steady duty cycle. Yet the recommended action on the snapshot is to contact the owner. The reason is the data quality signal. The device stopped reporting on 17 October and stayed silent for eight days, during hours when this vehicle has worked almost every day for nine months.
A device that goes dark during a vehicle’s normal working hours is frequently more actionable than any single speeding event, and it needs no behavioural history to detect.
The silence could mean the device was disconnected, the vehicle has a fault, the battery is out of service, or the vehicle has stopped working altogether. Each of those needs a different response, and every one of them is cheaper to handle on day two than on day forty. A fixed rule system would likely have missed it, because nobody writes a rule for “this specific vehicle is quiet at its usual hours”. Navionyx IQ caught it because it knows what this vehicle’s usual hours are.
Who uses a Navionyx IQ report, and for what
EV fleet operators: spot underused vehicles, vehicles drifting from their routine, and driving patterns that will cost battery life.
NBFCs and lenders: monitor financed EVs as assets, prioritise outreach, and keep an auditable record behind every flag.
EV makers: understand real world duty cycles to support warranty decisions and product design.
White label partners: license the analysis layer through an API and carry the Powered by Navionyx IQ mark inside their own product.
What Navionyx IQ does not do
A report that only lists strengths is not credible, so we publish the limits too. Navionyx IQ does not predict crashes or driver intent. It does not score a vehicle it has not seen enough of, and it withholds schedule based conclusions when a vehicle’s pattern is not stable enough to trust. It does not identify drivers without an identification signal. It does not immobilise or act on any vehicle; every operational decision stays with the customer. Device integrity checks work from the first week, territory analysis becomes meaningful at around three weeks, and schedule based conclusions need a longer record.
Conclusion
An EV fleet is a set of batteries on wheels, and the way each vehicle is used decides how long that battery lasts and how much value the asset holds. A tracking map cannot tell you that. A baseline built from the vehicle’s own history can. This report showed a vehicle that was working hard and driving reasonably well, and still produced one urgent action because the system knew what normal looked like for that exact vehicle. That is the promise of EV fleet behaviour analytics done properly: fewer false alarms, earlier real ones, and a visible reason behind every number.
This article was researched and written with AI assistance and reviewed by the Navionyx team. Report data shown is from a real vehicle on the Navionyx platform, anonymised before publication.
See Navionyx IQ against your own vehicles
We will run a behaviour profile on vehicles you already know and walk you through the reasoning behind every number.
Explore Navionyx IQ Talk to our team