EV Charging Analytics and Energy Intelligence
Navionyx gives EV operators, OEMs, and charging networks real-time visibility into how every vehicle charges, where battery stress is building, and which charging patterns are accelerating degradation.
EV Fleets Are Charging Blind
Most EV operators, OEMs, and charging networks share the same gap: they know a vehicle plugged in and eventually reached full charge. They do not know how long that session actually took, whether the charger performed correctly, what temperature the battery reached during the session, or whether the driver deep-discharged the pack before plugging in. That information sits locked inside the BMS and the charging hardware, never surfaced to the people who need to act on it.
The consequences compound quietly. A vehicle that is routinely deep-discharged before each charge accumulates electrochemical stress that standard fleet dashboards never flag. A charger that delivers 60% of its rated output gets labelled as functioning because the session completed. A driver who habitually charges to 100% and leaves the vehicle sitting in summer heat shortens the pack's usable life without anyone noticing until the range starts to visibly drop.
Geotab's 2026 analysis of more than 22,700 electric vehicles identified charging behaviour as the leading operational driver of battery degradation. Vehicles relying on high-power DC fast charging for more than 12% of their sessions degrade at roughly 3.0% per year, double the rate of vehicles using AC or lower-power charging at approximately 1.5% per year. That difference, over a three-year fleet ownership cycle, translates into meaningful asset value loss and earlier-than-expected battery replacement costs.
No charging session history
No way to distinguish a healthy 4-hour overnight charge from a failed session that charged for 20 minutes and stalled.
No battery temperature data during charging
Thermal stress builds across sessions undetected, accelerating capacity fade without triggering any operational alert.
No deep discharge visibility
Vehicles returned to the charger at critically low SoC on a regular basis, a pattern that damages the battery far more than normal daily cycling.
No charger utilisation data
Fleet operators and charging network owners cannot tell which chargers are underused, which are overloaded, or which are performing below rated output.
No charging behaviour score
One driver may consistently charge in ways that protect battery life. Another may consistently harm it. Without a score, no fleet manager knows which is which.
No abnormal pattern alerts
Slow charging caused by connector degradation, grid supply issues, or BMS faults goes undetected until a vehicle fails to complete a shift with adequate range.
Six Layers of EV Charging Intelligence
Navionyx EV charging analytics run on top of the same BMS hardware that monitors battery health across your fleet. No additional hardware is required beyond the Navionyx BMS device already installed on the vehicle. Charging intelligence is a native layer of the platform, not an add-on.
Charging Session History and Duration Tracking
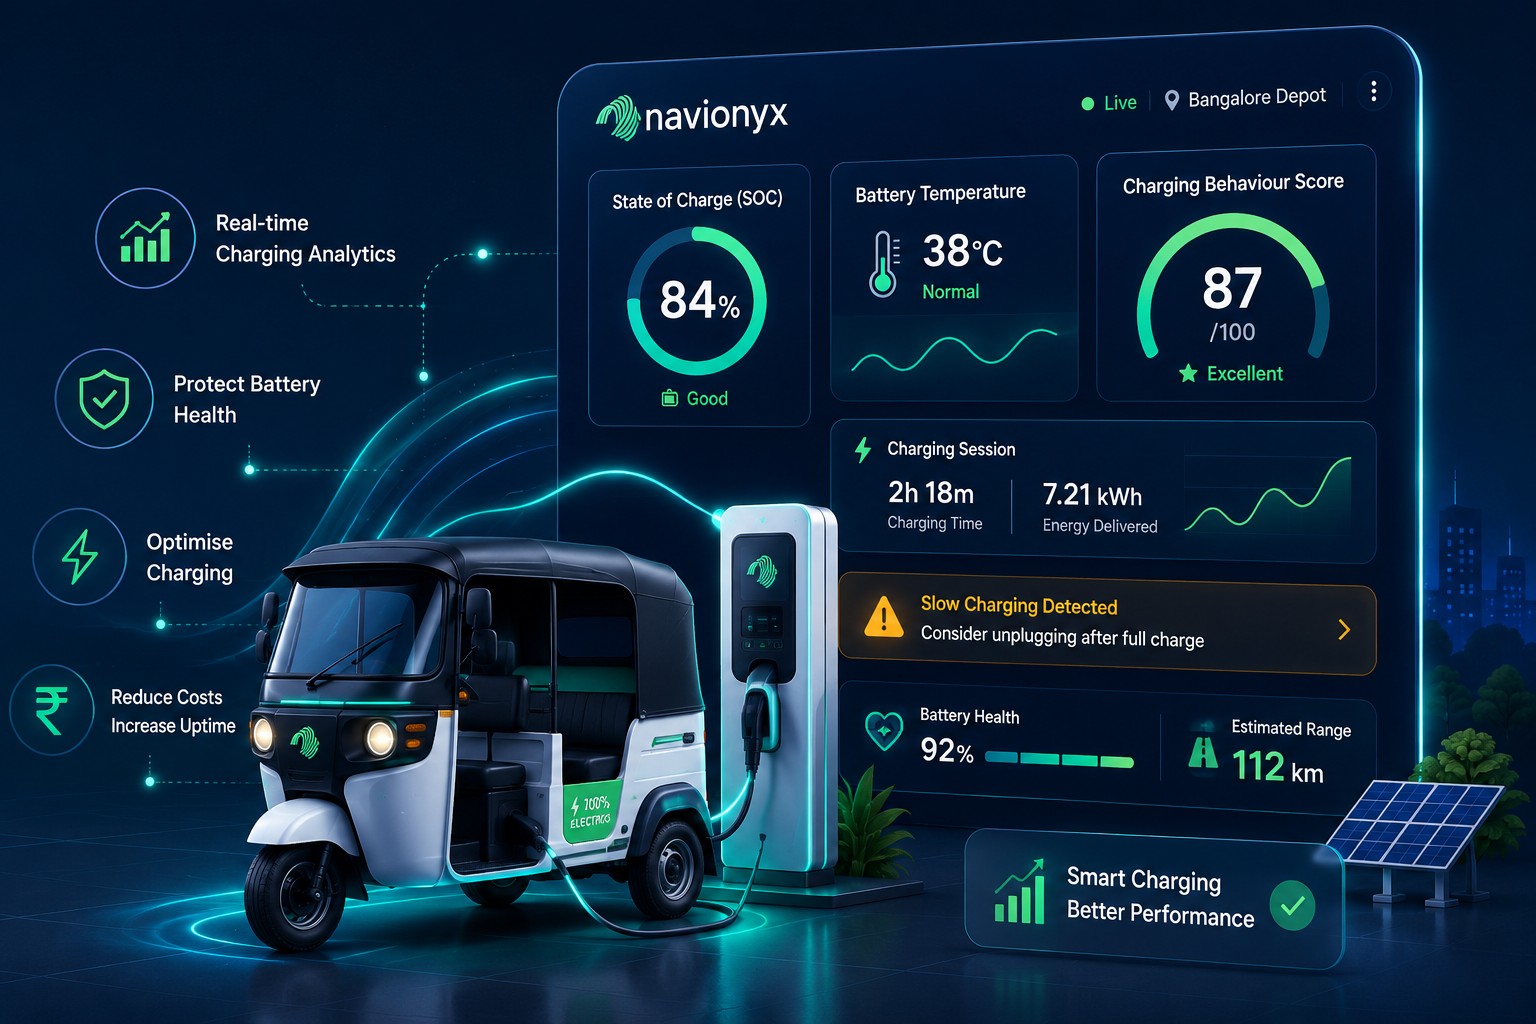
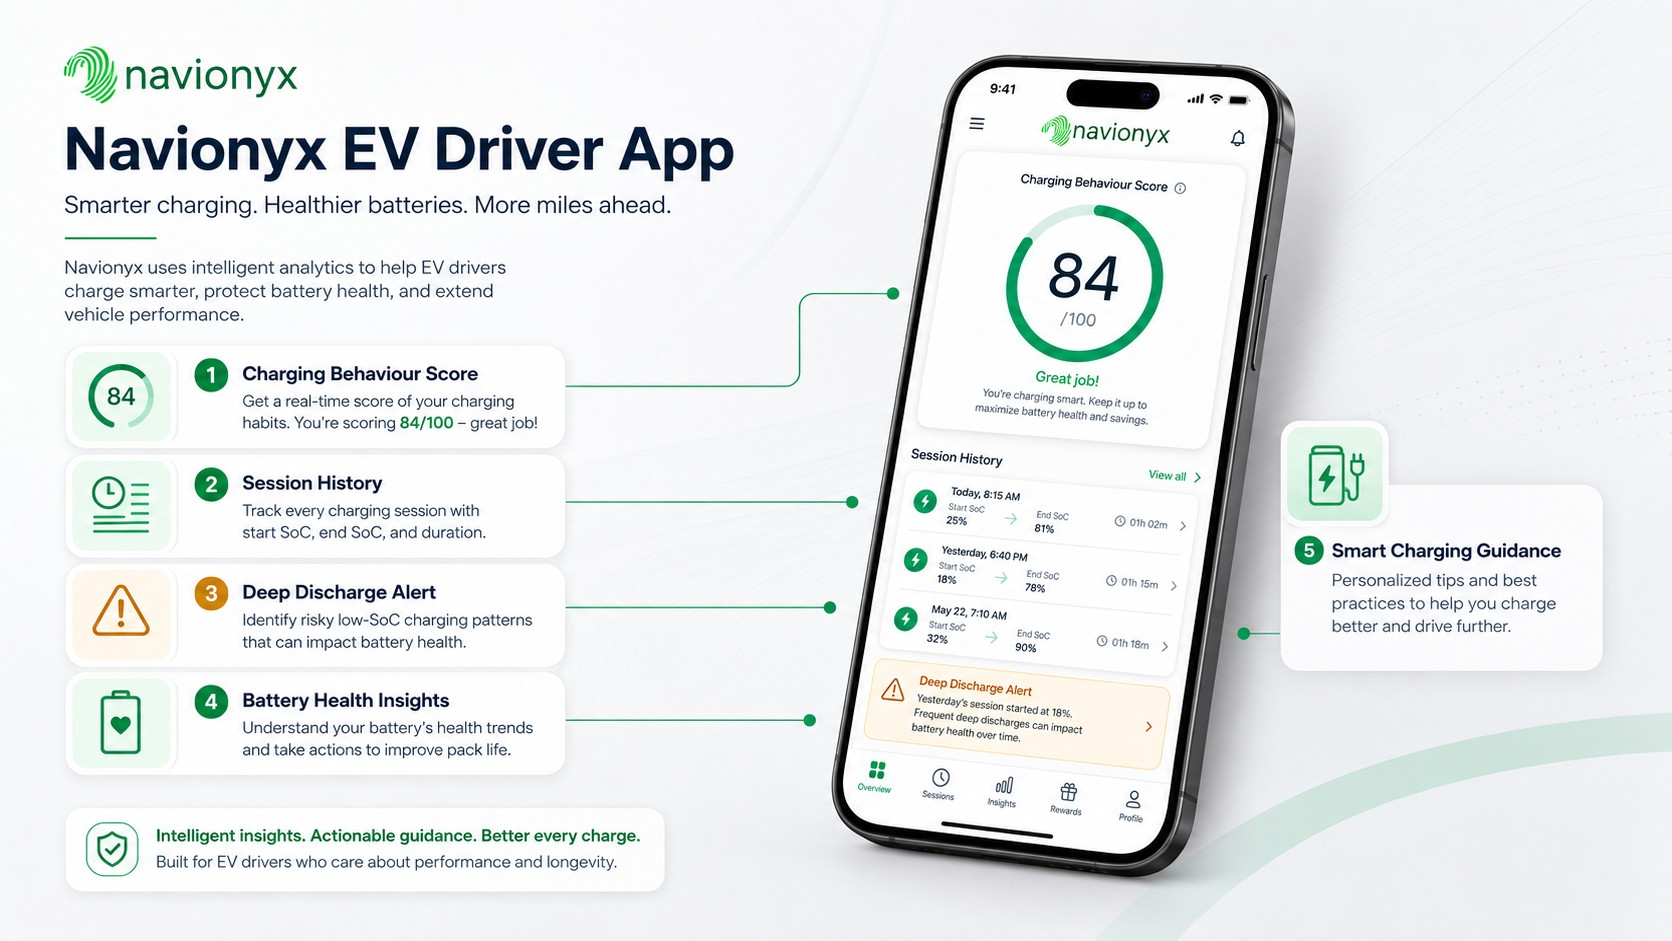
Every charging event is recorded automatically: start time, end time, duration, SoC at session start, SoC at session end, and energy added during the session. Historical records are available per vehicle and per driver, searchable by date range, route, or operating region.
Slow Charging and Abnormal Pattern Alerts
When a session is taking measurably longer than expected, or when charging stalls, drops, or oscillates in a pattern that deviates from the vehicle's normal profile, Navionyx triggers an alert via the platform, SMS, and the Navionyx driver app.
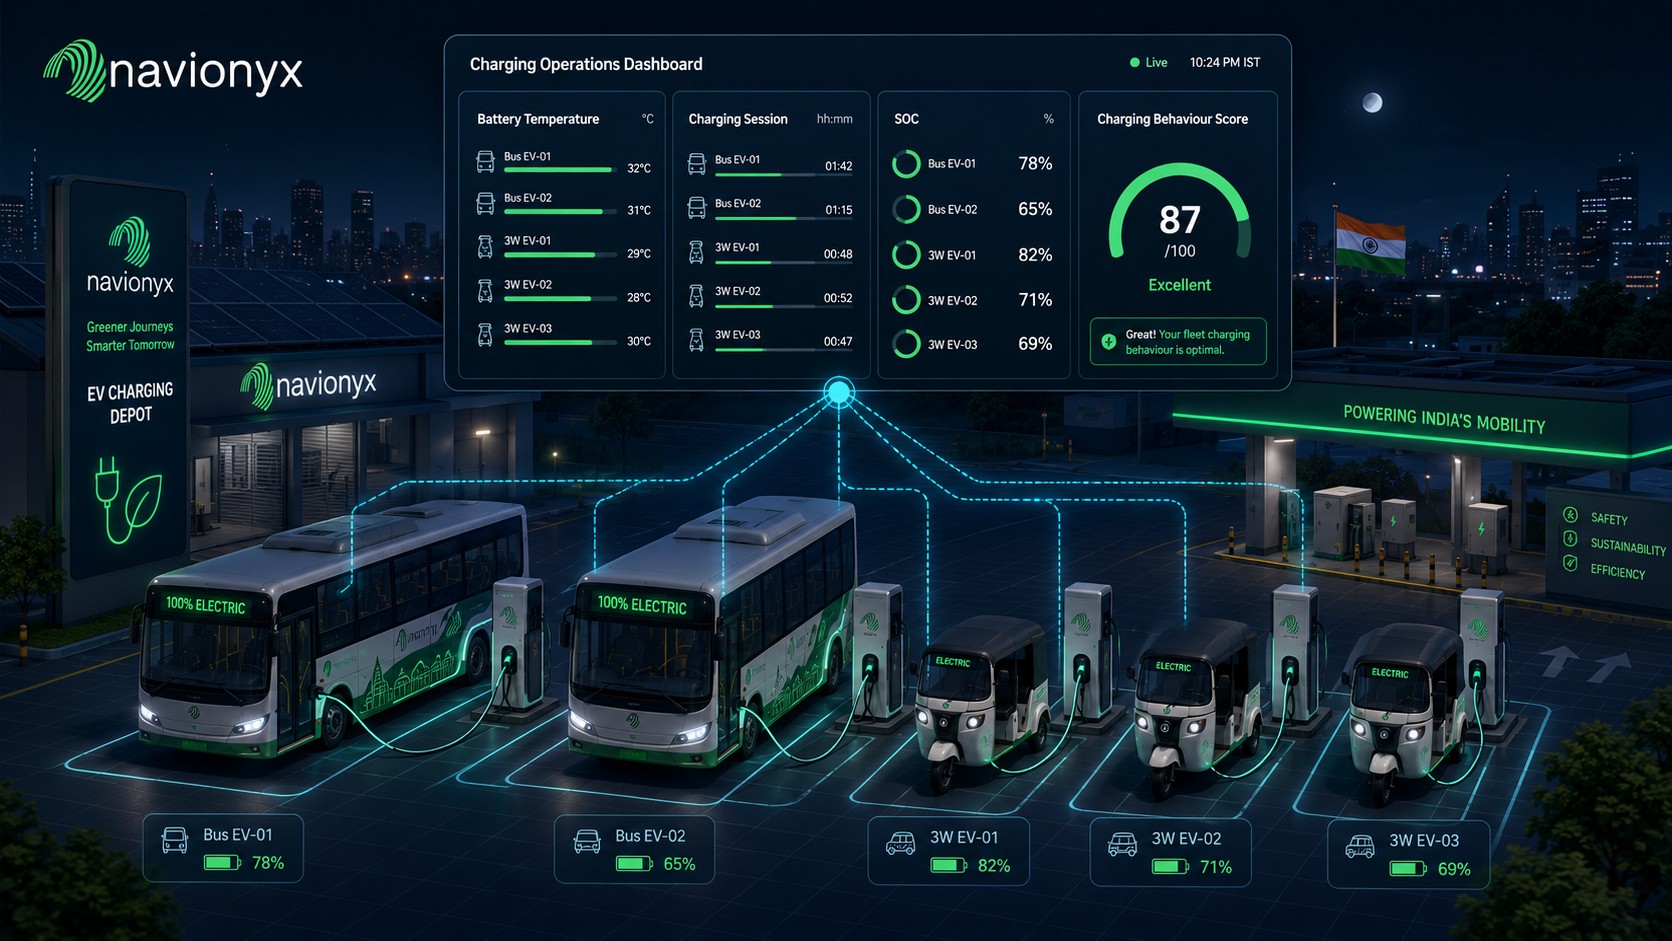
Charger Utilisation Analytics
For fleet operators managing a depot and for charging network operators monitoring station performance, Navionyx provides per-charger utilisation data: sessions per day, peak usage windows, average session duration, and idle time.
Battery Temperature Monitoring During Charging
The Navionyx BMS reads pack temperature throughout every session. High ambient temperatures combined with fast charging are the most damaging combination for lithium-ion cells. When pack temperature crosses a threshold, the platform flags and logs the event.
Deep Discharge Detection and Alerts
A vehicle that regularly returns to the charger below 10% SoC is operating in a deep discharge pattern. Navionyx identifies this pattern per vehicle and per driver, flags it in the dashboard, and surfaces it in the driver app so the behaviour can be corrected before damage compounds.
Charging Behaviour Score Per Vehicle and Driver
Every vehicle and driver receives a charging behaviour score based on how consistently they charge within healthy parameters: avoiding deep discharge, not routinely charging to 100% in high-temperature conditions, using the appropriate charger type, and completing sessions without abnormal patterns.
From BMS to Dashboard in Real Time
Navionyx charging analytics do not rely on charger-side data or network-level logs. The intelligence comes from within the vehicle itself, which means it works whether the vehicle charges at a depot, at a public station, at a customer site, or at a driver's home.
BMS Device Reads the Battery During Charging
The Navionyx BMS device, installed directly on the vehicle, monitors cell voltage, pack temperature, state of charge, current flow, and charge rate continuously throughout every session — independent of what charger brand or network is in use.
Data Transmits Over Cellular to the Navionyx Platform
All BMS readings are transmitted in near real-time to the Navionyx platform over the cellular network. Session data is time-stamped, attributed to the vehicle and the driver, and appended to the vehicle's running health record.
Intelligence Surfaces in the Dashboard, App, and API
Fleet managers see charging data in the Navionyx web dashboard. Drivers see their charging score and active alerts in the Navionyx mobile app. OEM and enterprise partners can pull session data, scores, and alerts directly through the Navionyx API and webhooks.
The Navionyx platform exposes charging session data, temperature logs, deep discharge events, and behaviour scores via REST API. Webhook-based real-time alerts can be configured to push to any endpoint, making it straightforward to embed Navionyx charging intelligence into an existing product or fleet management platform. Full API documentation is available at docs.navionyx.io.
Charging Alerts That Reach the Driver, Not Just the Dashboard
Fleet managers cannot be in the loop on every charging event for every vehicle. Drivers need real-time feedback at the point where behaviour change is still possible — during the session itself or immediately after.
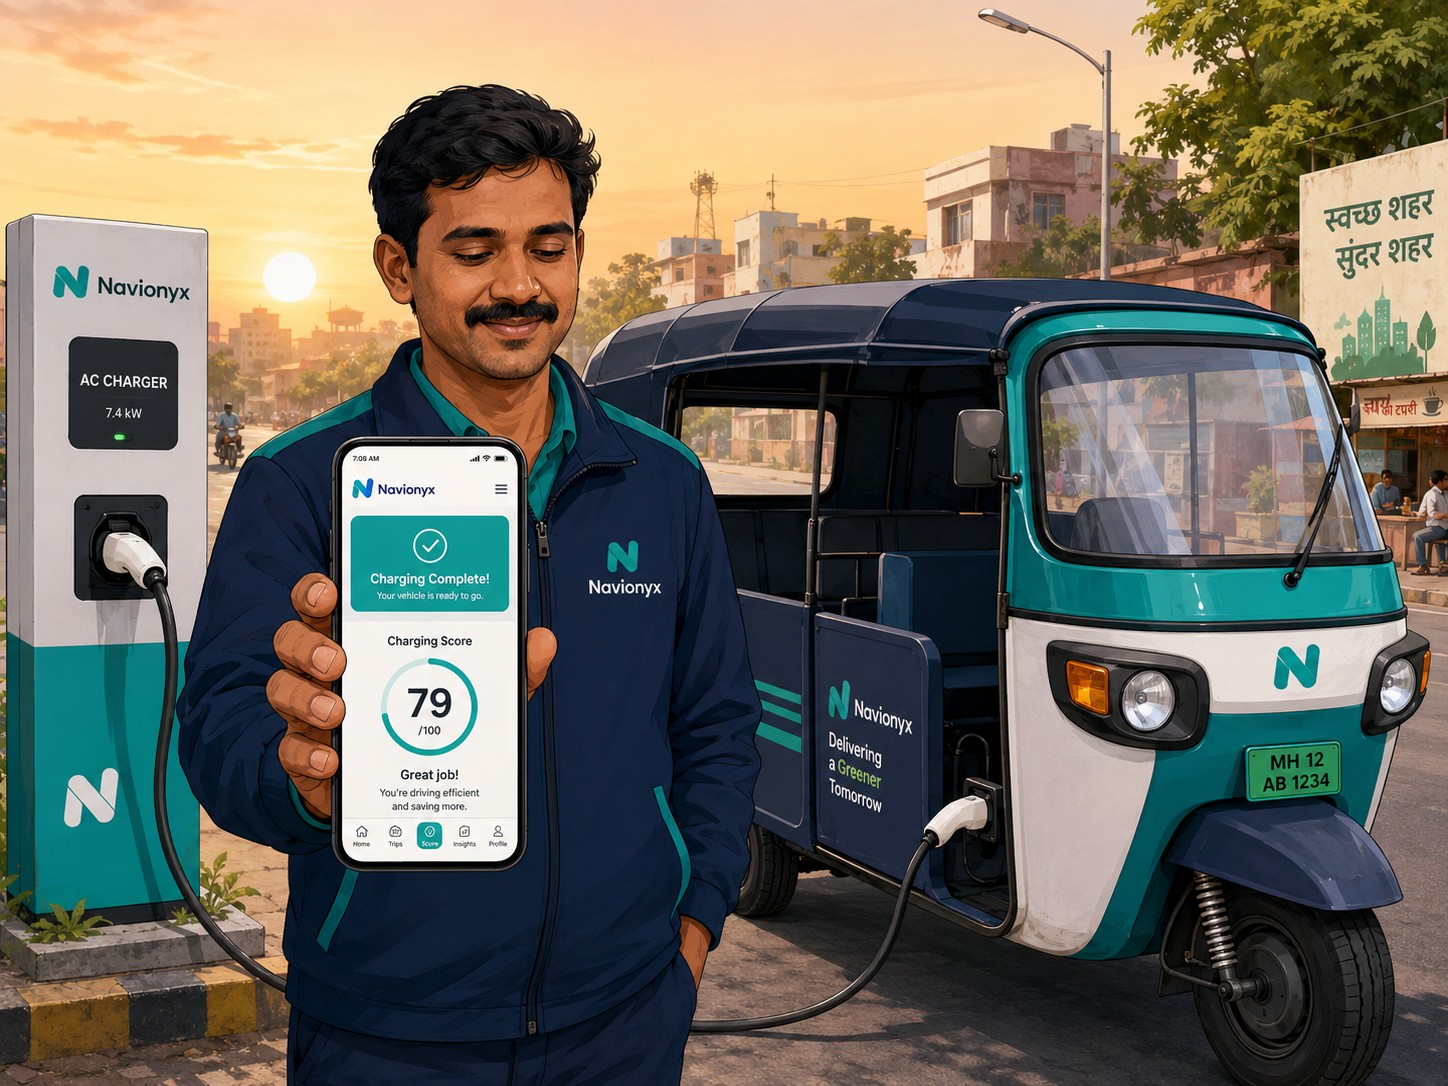
The Navionyx driver app delivers charging intelligence directly to the person plugging in the vehicle. When a session begins, the app confirms the session start and the current SoC. If the charger is underperforming, the driver receives a slow charging alert while still at the station, giving them time to switch ports or report the issue rather than discovering the problem the next morning.
After each session, the driver sees their updated charging behaviour score, with a breakdown of what contributed to the score: whether they started the session with a healthy SoC level, whether the session completed fully, and whether any temperature event was recorded.
For fleets operating under driver incentive or retention programmes, the score provides a measurable, objective data point for performance conversations that is grounded in what actually happened to the battery, not just what the driver reports.
The same charging signals also feed our predictive maintenance for EV fleets workflow, where repeated thermal stress, deep discharge, and abnormal sessions are converted into maintenance risk and inspection timing.
For OEM and battery partners, this charging-side evidence also strengthens battery warranty validation by showing whether a failed pack was exposed to abusive charging patterns, repeat deep discharge, or temperature stress long before the claim was filed.
For lenders financing electric two wheelers and three wheelers, these same driver-side and battery signals can also support EV loan asset protection by keeping borrowers engaged, reducing ghost defaults, and improving recovery timing when field action becomes necessary.
Built for Every Stakeholder in the EV Charging Chain
EV OEMs
Your vehicles are in the field. You know the specifications but not how those specifications are holding up under real-world charging patterns. Navionyx gives you field data on charging behaviour across your deployed fleet, including temperature stress events, session durations, and depth-of-discharge patterns that warranty claims rarely surface until the damage is done.
Battery OEMs
Pack performance in the field depends heavily on how vehicles are charged. Without charging behaviour data, warranty claim analysis is incomplete. Navionyx provides session-level charging history, temperature logs during charging, and deep discharge frequency per vehicle, so every claim can be evaluated against the actual operating record.
Fleet Operators
Range reliability and battery longevity are operational problems, not technical ones. Navionyx gives your operations team the charging score, session history, and abnormal pattern alerts needed to set charging policies and enforce them with data rather than assumption.
Charging Networks
Charger utilisation data from the vehicle side complements network-side logs. Navionyx shows you exactly how vehicles are using your infrastructure: which sessions complete successfully, which are slow, and which reflect charger-side performance issues rather than vehicle-side problems.
What Charging Patterns Actually Do to a Battery Over Time
Charging is not a neutral event for a lithium-ion battery. Every session adds to the cumulative stress history of the pack, and the conditions of each session determine how much of that stress stays benign and how much accelerates degradation.
The three patterns that do the most damage in commercial EV fleets operating in India are consistent and measurable. First is deep discharge before charging: vehicles that return to the charger at below 10% SoC on a regular basis put the cells through additional stress at both ends of the charge cycle. Second is sustained high pack temperature during charging, which is particularly relevant in Indian summers when ambient temperatures in parking areas and depot yards routinely exceed 40 degrees Celsius. Third is incomplete sessions, where a slow charger or faulty connector results in a vehicle leaving with far less SoC than the driver assumes, leading to range anxiety, unplanned top-ups, and deeper discharge patterns on the same day.
Navionyx data from vehicles monitored across our platform consistently shows that the difference between a well-managed charging programme and an unmanaged one is visible in battery health metrics within three to six months of deployment.
The gap between these two numbers is not a design flaw. It is a charging behaviour outcome. Managing that behaviour is what Navionyx EV charging analytics is built to do.
Frequently Asked Questions
See What Is Happening Inside Every Charging Session
Request a demo and we will show you live charging data from vehicles already on the Navionyx platform.