Battery health metrics
SoH, SoC, SoP, capacity fade, calendar aging, internal resistance, and end-of-life thresholds.
Every battery metric and telematics term explained in plain language. Built from real deployment data by the team that monitors thousands of EVs across India. Download the complete reference PDF.
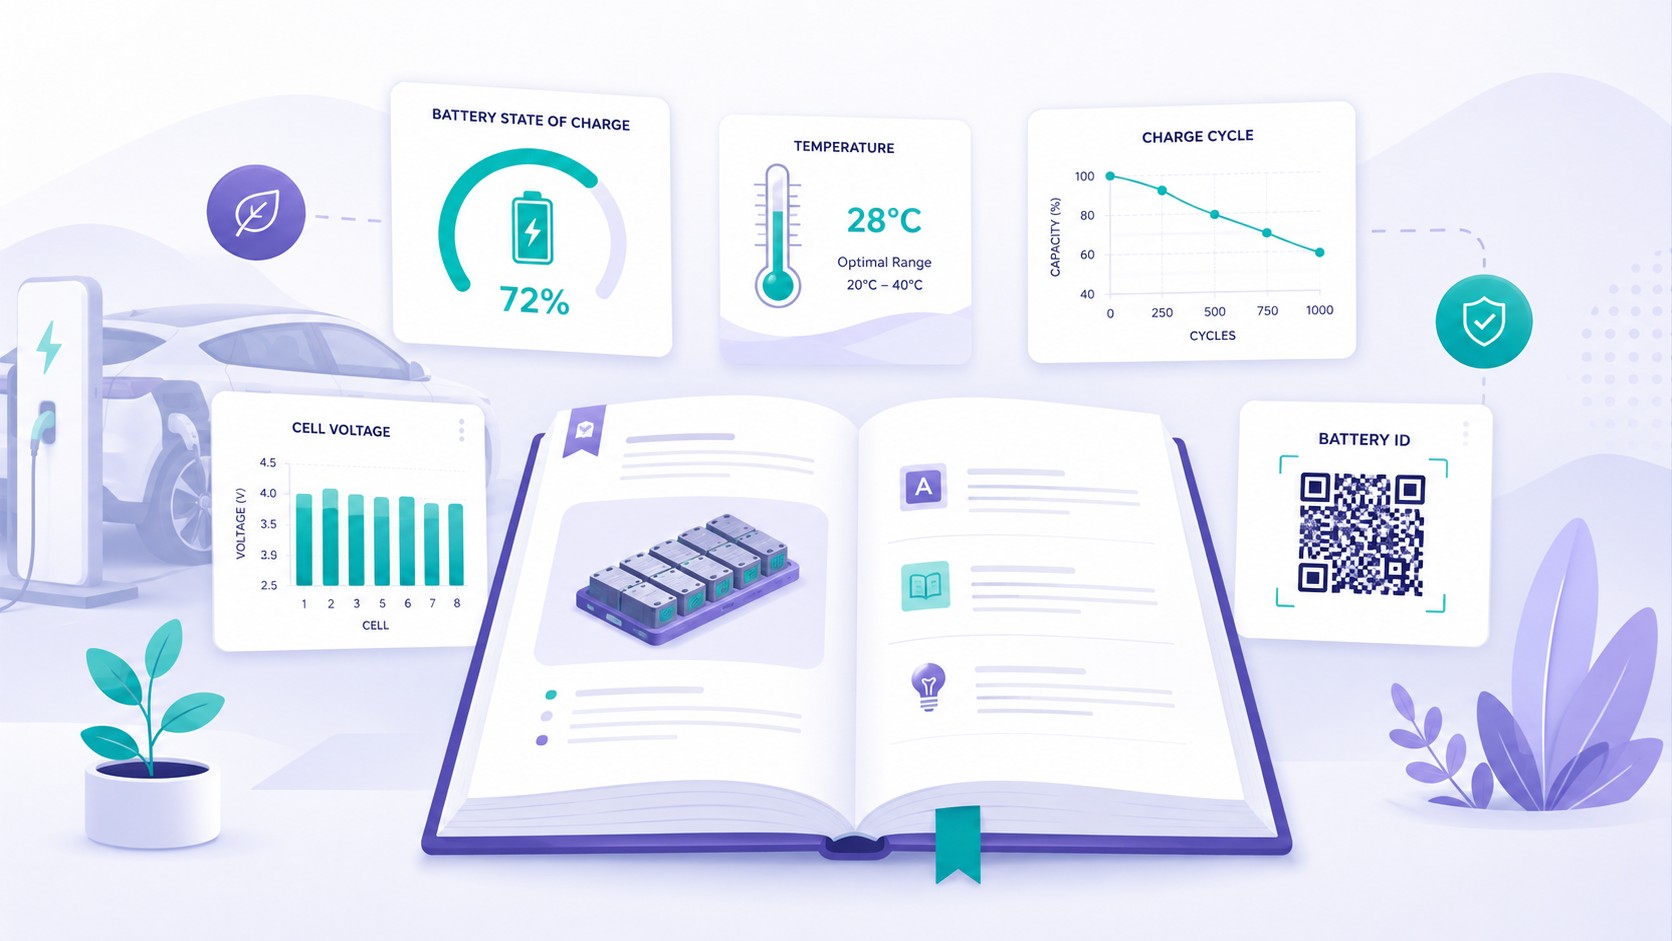
The EV battery space has its own language. SoH, SoC, DoD, C rate, cell balancing, thermal runaway, capacity fade, calendar aging, and internal resistance are not abstract engineering terms when you work in lending, dealership evaluation, insurance, or fleet operations. They directly influence battery value, warranty interpretation, risk scoring, and resale decisions.
This glossary is built for teams that need battery literacy without needing an electrochemistry degree. If your organisation finances EVs, sells used EVs, underwrites EV fleets, or is just starting to operate electric vehicles at scale, this page and the downloadable PDF are designed to become a practical reference in meetings, reports, and day-to-day evaluations.
Every term in the full glossary includes a plain-language definition, a practical example, and where relevant, a connection to the Navionyx metric, dashboard, or report that captures it in the field.
SoH, SoC, SoP, capacity fade, calendar aging, internal resistance, and end-of-life thresholds.
Cycle count, DoD, C rate, fast charge ratio, coulomb counting, and charge curve behaviour.
Cell balancing, cell voltage variance, series and parallel layouts, and the weakest-cell effect.
Thermal runaway, thermal management systems, operating temperature range, and BMS protection logic.
Battery passport, AIS 156, BIS standards, EPR, and Battery Waste Management Rules 2022.
This preview gives enough value to show the quality of the full PDF while keeping the complete glossary gated.
The overall condition of a battery compared to when it was new, expressed as a percentage. A battery at 90% SoH holds 90% of its original energy capacity. SoH is the most referenced number in used EV evaluation, but it is only a headline metric. Cell level variance, charging patterns, and thermal history still shape the real condition of the pack.
A three year old electric SUV showing 88% SoH may look healthy at first glance. But if two cells sit 40mV below the pack average, the usable capacity and future degradation risk are worse than the headline suggests.
The percentage of total battery capacity used before recharging. A DoD of 80% means the battery was discharged to 20% remaining. Repeated deeper discharge cycles place more electrochemical stress on cells. Keeping daily DoD lower generally extends pack life.
A fleet operator regularly driving vehicles down to 5% charge is applying deeper stress than one who keeps vehicles between 20% and 80% SoC. Over time that difference shows up in faster degradation.
The speed at which a battery is charged or discharged relative to its capacity. A 1C rate means a full charge or discharge in one hour. Fast DC charging usually sits around 1C to 2C, while slower AC charging is much gentler. Higher C rates generate more heat and accelerate wear.
A 40 kWh battery charged at 40 kW is charging at roughly 1C. Charging the same battery at 8 kW AC is around 0.2C and produces far less thermal stress.
The process of equalising charge across individual cells in a battery pack. Without balancing, some cells age or fill faster than others, reducing usable capacity and creating safety risk. The BMS performs this during charging. Passive balancing burns off excess energy as heat, while active balancing redistributes it.
In a 96-cell pack, if one cell reaches its upper voltage limit before the rest, the BMS has to manage that difference so the pack can continue charging safely. Otherwise the weakest or earliest-filling cell limits the whole pack.
A dangerous event where a battery cell overheats uncontrollably and can trigger fire or explosion. It can start from internal shorts, impact damage, overcharging, or sustained heat exposure. Modern systems rely on BMS protection and thermal management to prevent it. Thermal history matters because past heat stress can weaken cells long before visible damage appears.
A battery pack that triggered a summer thermal warning may still look normal externally, but cells exposed to that event can degrade faster in the months that follow.
A digital identity record for every battery pack, usually tied to a unique ID or QR code for lifecycle traceability. It can include manufacturing details, chemistry, performance history, safety events, and recycling records. India is moving toward broader battery passport requirements through evolving CPCB-linked frameworks.
A used EV buyer scanning a battery passport-style record could see the pack chemistry, manufacturing date, cycle history, and recycling chain status before purchase. Navionyx's certificate and traceability flows already support much of that need.
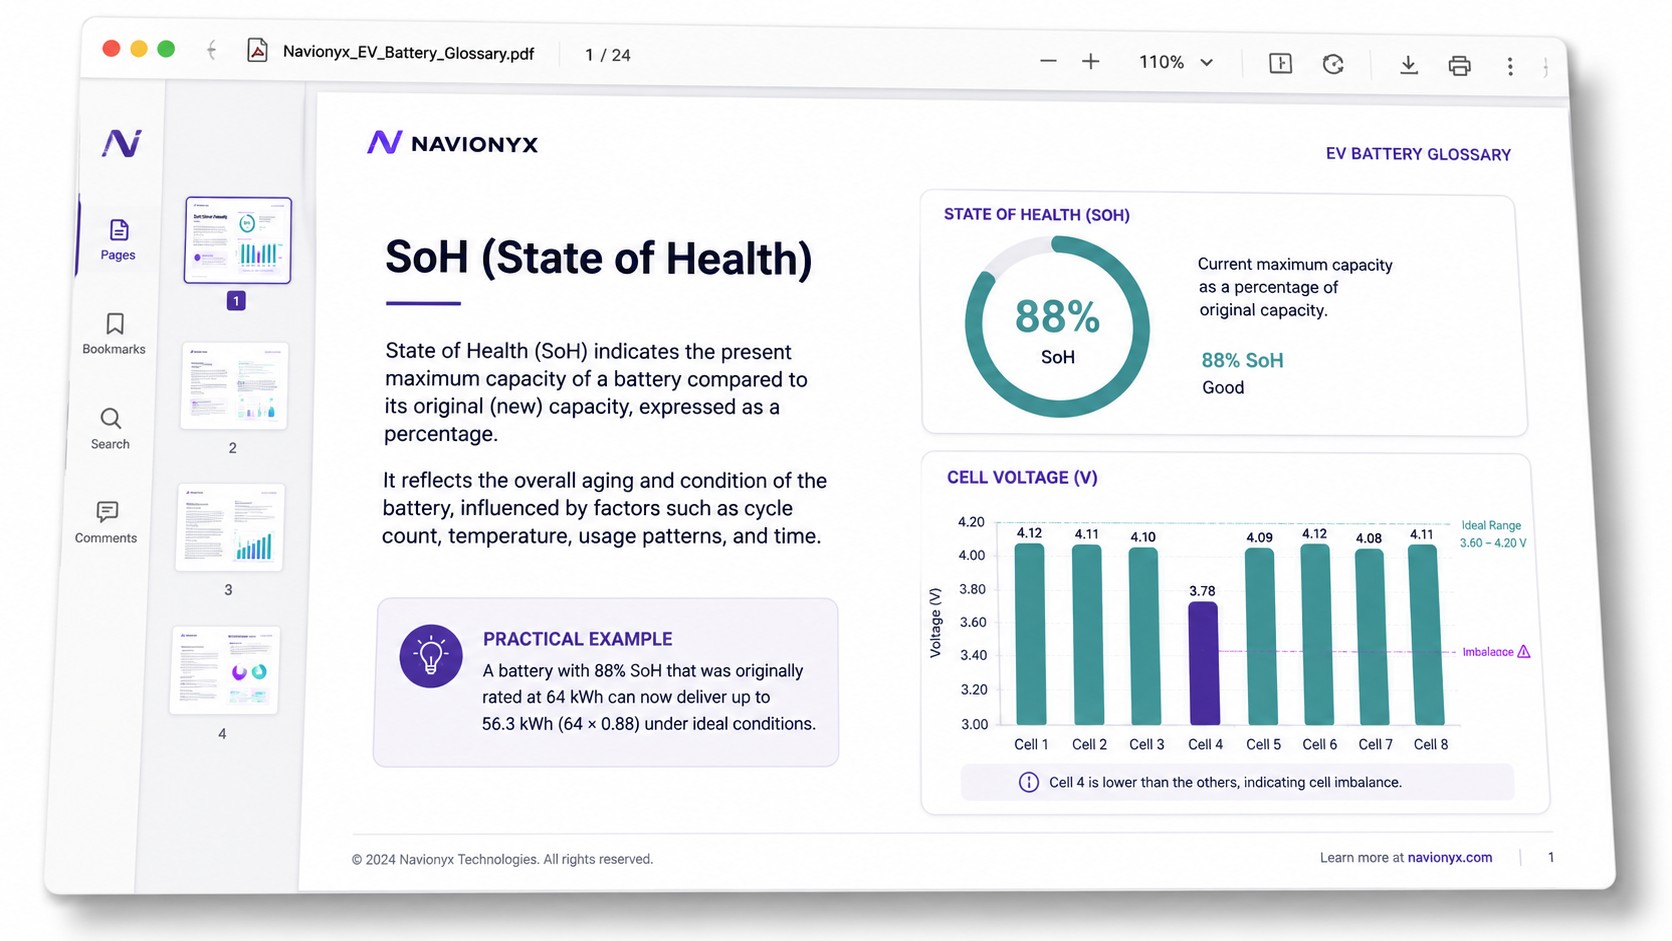
Understand what SoH, cycle count, degradation trajectory, and thermal history really mean for collateral quality and residual value decisions.
Give sales and evaluation teams a reference they can actually use when explaining battery condition to buyers without technical jargon.
Translate battery condition, charging behaviour, and thermal risk into the underwriting language that drives EV policy decisions.
Bridge the gap between traditional fleet operations and the battery-specific metrics that matter for uptime, warranty, and total cost of ownership.
Fill in your details to unlock the signed glossary PDF and the quick reference card. After submission, both download links will appear here.
Your downloads are ready. Use the two buttons below to download the full terminology guide and the quick reference guide.
See how SoH, cycle count, cell variance, and degradation trends are captured in a real battery health report.
Tell us about your vehicles, operating model, or financing workflow and we will tailor a walkthrough to the way your business actually runs.
Share your company details once and we will route the request to the right team.

Real-time insights. Predictive analytics. Seamless EV operations.

Now available on Google Play

Now available on App Store
Monday – Friday
10:00 am – 8:00 pmSaturday – Sunday
12.00 pm – 06.00 pmAddress:
Navionyx Mobility Solutions Private LimitedEmail:
info@navionyx.com



Made in 🇮🇳 India