EV Intelligence · Practical Guide
A step by step guide for dealership teams evaluating used EV battery condition. Print it, pin it, use it on every vehicle that enters your lot.
July 2026 · 10 min read
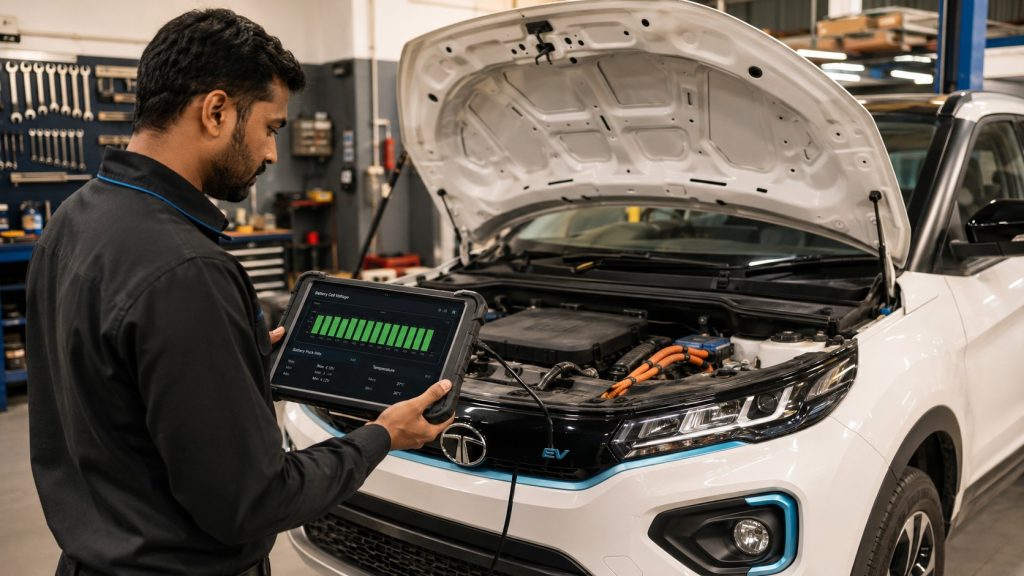
When an ICE vehicle arrives on your lot, your team knows the inspection routine. Check the engine, the transmission, the clutch, the suspension, the bodywork, and the service records. The process has been standardised for decades.
When a used EV arrives, most dealerships apply the same routine and skip the one component that actually matters most: the battery. Not because they do not care, but because they do not have a clear, repeatable process for assessing it.
The battery pack accounts for 35% to 45% of a used EV’s total value. Its condition determines range, performance, resale price, and buyer confidence. Yet India currently has no mandatory battery health certification framework for used EVs. No standardised disclosure rules exist under the Central Motor Vehicle Rules. The result is that most used EVs are listed, priced, and sold without any verified battery data.
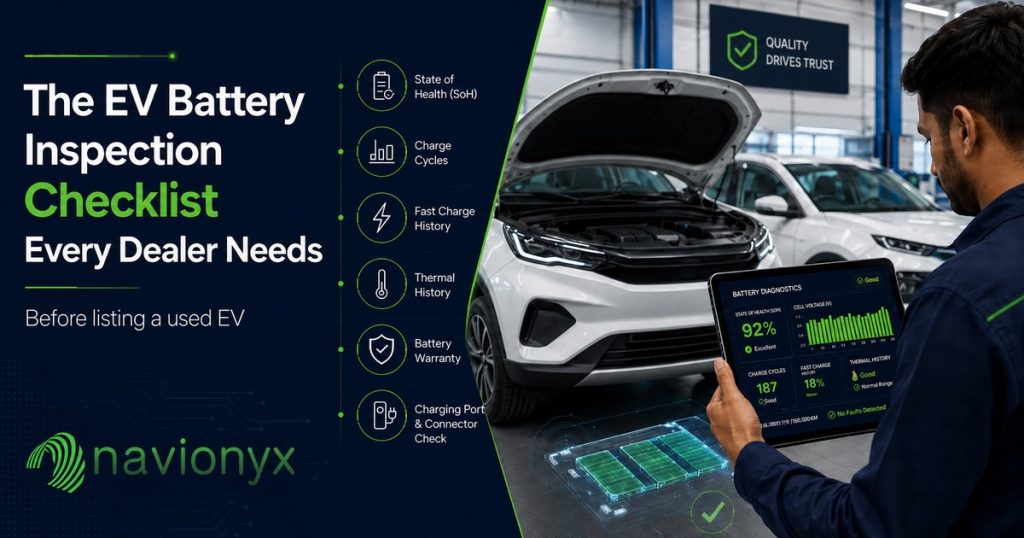
This guide changes that for your dealership. Below is a complete EV battery inspection checklist you can use on every used electric vehicle that enters your inventory. It covers what to check, what the readings mean, and where to draw the line between a vehicle worth listing and one that needs deeper evaluation.
Check 1: State of Health (SoH) Reading
Start here. If the battery fails this check, everything else is secondary.
State of Health is the percentage of original battery capacity still available. A new EV starts at 100% SoH. Over time, through charging cycles, temperature exposure, and usage patterns, capacity gradually decreases.
How to check
Some OEMs display SoH directly in the vehicle’s infotainment system or connected owner app, depending on the manufacturer. For brands that do not expose this data natively, use an OBD II diagnostic tool with EV specific software. If neither option is available, request a battery health report from the manufacturer’s authorised service centre.
What the numbers mean
✓ Above 85% SoH: Healthy. Safe to list with confidence. Range will be close to original specifications.
✓ 70% to 85% SoH: Acceptable if priced accordingly. Range reduction will be noticeable. Buyer must be informed. Check whether the vehicle still falls within warranty thresholds.
✓ Below 70% SoH: Serious concern. Most OEM warranties guarantee at least 70% capacity over 8 years. A vehicle below this threshold either has a valid warranty claim or is approaching the need for pack replacement, which can cost several lakhs. Evaluate carefully before listing.
Important: the dashboard SoH reading is a starting point, not the full picture. A vehicle can show 88% SoH on the dashboard while individual cells within the pack are drifting apart. That is why this checklist goes beyond the headline number. SoH alone does not tell you how the battery was used, how it was charged, or what its degradation trajectory looks like. For the full context on why SoH is not enough, read our deep dive on why EV battery health is more than SoH.
Check 2: Charge Cycle Count
A charge cycle is one complete discharge and recharge of the battery’s full capacity. Two partial discharges of 50% each count as one full cycle. The total cycle count tells you how intensively the battery has been used, independent of the vehicle’s odometer reading.
Why this matters more than mileage
A vehicle used for short urban commutes with frequent partial charges will have a different cycle count than one used for long highway trips. Two EVs with identical odometer readings can have vastly different cycle counts. The cycle count, combined with the SoH, gives you a far more accurate picture of the battery’s actual wear than kilometres driven alone.
How to access
Cycle count data is not always visible in the dashboard. OBD II tools with EV specific modules can often read this from the BMS (Battery Management System). If the vehicle has been monitored through a telematics platform like Navionyx, the charge cycle history is captured from first deployment. For vehicles without telematics history, an authorised service centre diagnostic may be needed.
Check 3: Fast Charge Ratio
This is one of the most overlooked factors in used EV assessment, and one of the most important.
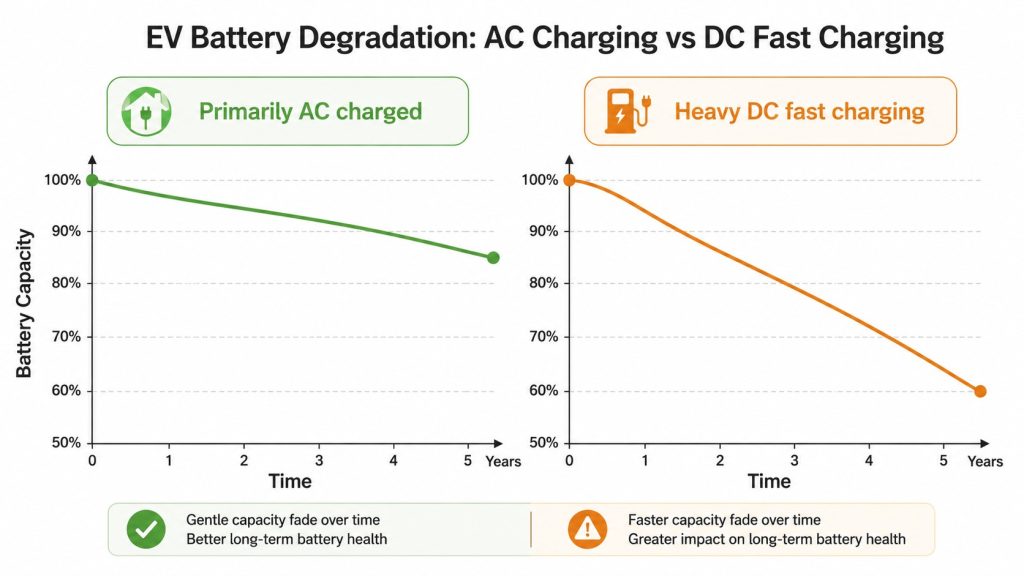
Every EV can be charged in two ways: slow AC charging (typically at home, 3 to 7 kW) and fast DC charging (at public stations, 25 to 150 kW). DC fast charging pushes significantly more current into the battery in a shorter time, which generates more heat and places more stress on the cells.
A vehicle that has been fast charged for 80% or more of its charging events has experienced materially more thermal stress than one that was predominantly home charged on AC. Research consistently shows that heavy fast charging accelerates degradation. Some studies indicate that regular fast charging can increase degradation rates by 20% to 30% compared to predominantly slow AC charging.
What to look for
✓ Fast charge ratio below 30%: Good. The battery has been primarily slow charged. Lower thermal stress.
✓ Fast charge ratio 30% to 60%: Moderate. Common for vehicles used for daily commuting with occasional highway trips. Acceptable if SoH is healthy.
✓ Fast charge ratio above 60%: High. Likely indicates fleet usage, ride hailing, or a driver without home charging access. Price the vehicle accordingly. This is not a disqualification, but it is a risk factor that should be reflected in the listing price.
Check 4: Depth of Discharge Patterns
Depth of Discharge (DoD) refers to how deeply the battery is drained before recharging. A DoD of 80% means the battery was used down to 20% remaining charge before being plugged in.
Lithium ion batteries last longer when they are kept within a moderate charge range. Repeatedly draining the battery below 10% or charging it to 100% places additional stress on the cells. The ideal operating range for battery longevity is between 20% and 80% state of charge.
What to check
If the vehicle’s BMS data or telematics history shows frequent deep discharges (regularly below 10%) or frequent full charges to 100%, the battery has experienced more stress than typical usage would cause. This should be cross referenced with the SoH reading. A vehicle with moderate SoH degradation and a history of deep discharges is likely to degrade faster going forward than one with the same SoH but gentler charge habits.
Not sure about some of these terms? Download our EV Battery Terminology Glossary for clear, plain language definitions of SoH, DoD, C rate, cell balancing, and 30+ more terms.
Check 5: Cell Level Voltage Variance
This is where the inspection goes from surface level to truly diagnostic. A battery pack is made up of individual cells (sometimes hundreds of them) connected in series and parallel. In a healthy pack, all cells operate at nearly identical voltages. As a pack ages, individual cells can begin to drift apart.
Cell level voltage variance tells you whether the pack is aging uniformly or whether certain cells are degrading faster than others. High variance is a leading indicator of accelerated capacity loss, even if the overall SoH still looks acceptable.
Why your team needs to know this
A pack can show 85% SoH on the dashboard while one or two cells are significantly weaker than the rest. The BMS compensates by limiting the pack’s total output to match the weakest cell. The result: the vehicle appears healthy by headline metrics, but the weak cells will continue to deteriorate and pull down overall performance faster than the average suggests. Our analysis of this pattern is detailed in One Cell Is Lying to You: Here Is How We Know.
How to access cell level data
Cell level voltage data is not available through standard dashboard displays. It requires either an OBD II diagnostic tool with EV specific protocols or a telematics platform that reads data directly from the BMS. Platforms like Navionyx EV Resale Value Intelligence capture cell level data continuously from the point of first deployment, making this assessment straightforward for vehicles in the system.
Check 6: Thermal History
Temperature is one of the most significant factors in battery degradation. Lithium ion cells degrade faster when exposed to sustained high temperatures. In Indian conditions, this is especially relevant. A vehicle operated and parked outdoors in Nagpur, Jaipur, or Ahmedabad through three summers has experienced materially more thermal stress than one garaged in Bengaluru or Pune.
What to evaluate
✓ Check the vehicle’s registration history. Where was it registered? A Delhi NCR registration with summers exceeding 45 degrees Celsius is a different thermal profile than a Hyderabad or Chennai registration.
✓ Ask whether the vehicle has an active thermal management system (liquid cooling). Most modern EVs in India from mainstream manufacturers have liquid cooled packs. Older models or budget EVs may rely on passive air cooling, which provides less protection in extreme heat.
✓ If telematics data is available, check for any recorded instances of thermal warnings or battery temperature events. These indicate the battery was pushed beyond its comfortable operating range.
Check 7: Warranty Status and Transferability
Battery warranty is one of the strongest value indicators in the used EV market. Data from Indian used EV marketplaces consistently shows that vehicles with 4 to 6 years of battery warranty remaining command significantly higher prices and sell faster than those nearing warranty expiry.
What to verify
✓ Confirm the original warranty start date (not the vehicle purchase date, but the in service date from which the warranty period begins).
✓ Confirm the warranty is transferable to the next owner. Most major OEMs in India transfer the battery warranty, but verify the terms with the authorised service centre.
✓ Check whether any warranty claims have already been made on the battery. If the pack was replaced under warranty, the replacement pack may have its own warranty terms.
✓ For a deeper assessment of how warranty status intersects with battery condition, see our Battery Warranty Validation Intelligence solution.
Check 8: Charging Port and Hardware
The charging port is the physical interface that connects the vehicle to its energy source. While this is not a battery health metric, a damaged or malfunctioning charging port directly affects the vehicle’s usability and should be inspected on every used EV.
What to check
✓ Inspect the charging port for physical damage, corrosion, or bent pins.
✓ Confirm the connector type (CCS2 is the standard for most new EVs in India). Older models may have different connectors that limit compatibility with newer public chargers.
✓ If possible, plug the vehicle into a Level 2 charger and verify it accepts charge normally. Check that the charging rate displayed matches expected specifications.
✓ Confirm that the original charging cable is included with the vehicle. Replacement cables are an additional cost for the buyer if missing.

Check 9: Underbody and Pack Casing
The battery pack is mounted under the floor of the vehicle. Any impact damage to the underbody could have compromised the pack casing, which is a safety concern and a significant value issue.
What to inspect
✓ If a lift or ramp is available, inspect the battery pack casing for dents, cracks, or signs of road impact.
✓ Look for signs of crude repairs or aftermarket skid plates that may indicate previous underbody damage.
✓ Check for corrosion, especially in vehicles registered in coastal cities where salt exposure is higher.
Bringing It All Together: The Assessment Matrix
Once your team has completed all nine checks, the vehicle falls into one of three categories:
Category A: List with Confidence
SoH above 85%. Charge cycle count consistent with age. Fast charge ratio below 40%. No cell level anomalies. Active warranty with transferability confirmed. No underbody damage. This vehicle can be listed at market price with a clean battery health narrative.
Category B: List with Adjusted Pricing
SoH between 70% and 85%. Higher cycle count or fast charge ratio. Warranty remaining but less than 3 years. No physical damage. This vehicle can be listed but should be priced to reflect the battery’s reduced remaining life. Full disclosure to the buyer is essential.
Category C: Requires Further Evaluation
SoH below 70%. Significant cell level variance. Underbody damage present. Warranty expired or non transferable. Charging issues detected. This vehicle needs deeper diagnostic evaluation before listing. Consider whether the battery has a valid warranty claim or factor replacement cost into your acquisition price.
The Faster Way: Automate This Entire Checklist
This checklist is designed to be practical for any dealership, even without specialised EV diagnostic tools. But let us be direct: running nine checks manually on every used EV that enters your lot is time consuming and requires trained staff.
The Navionyx EV Resale Value Intelligence platform for dealerships automates this entire assessment. Connect the vehicle, let the platform read the BMS data, and receive a comprehensive battery health report covering SoH, cycle count, fast charge ratio, depth of discharge patterns, cell level variance, thermal history, and warranty status. The output is a QR verifiable Navionyx EV Certificate that you can attach to every listing.
Whether you use this manual checklist or the automated platform, the principle is the same: never list a used EV without understanding its battery. The dealerships that build this discipline into their intake process will own the trust advantage as India’s used EV market scales.
See What a Navionyx EV Certificate Looks Like
Download a sample battery health report showing charge cycle analysis, cell level diagnostics, degradation trends, and the overall resale readiness score.
Download Sample ReportRelated Reading
EV Battery Health Is More Than SoH: How Cell Level IoT Analytics Reveal the Real Story
One Cell Is Lying to You: Here Is How We Know
This article was researched and written with AI assistance and reviewed by the Navionyx team.