EV Intelligence · Technical Deep Dive
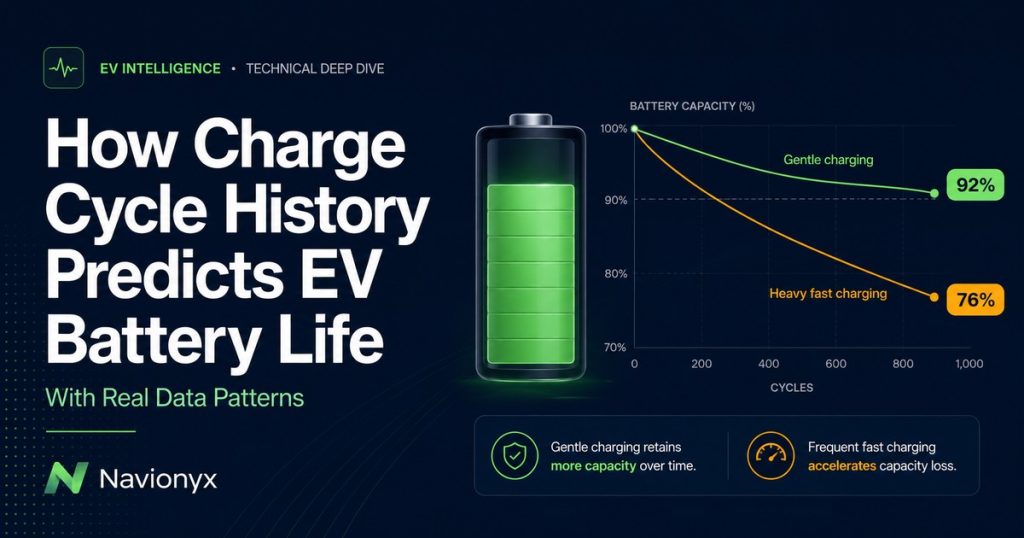
Two identical EVs. Same model. Same mileage. One battery has 92% health. The other has 76%. The difference is in the charge cycles, and the data proves it.
By Navionyx Team · July 2026 · 9 min read
When you evaluate a used ICE vehicle, the odometer tells you most of what you need to know about engine wear. A car with 40,000 km has experienced less mechanical stress than one with 80,000 km. Simple. Predictable. Universally understood.
EV batteries do not follow this logic. The odometer is almost irrelevant to battery health. What actually determines how much life a battery has left is not how far the vehicle has driven, but how it was charged.
The charge cycle history, including the total cycle count, the ratio of fast to slow charging, the depth of each discharge, and the thermal conditions during charging, is the single most predictive dataset for estimating remaining battery life. And in 2026, we finally have enough large scale, real world data to prove this conclusively.
What the Largest EV Battery Study Tells Us
In January 2026, a leading global telematics analytics firm published updated findings from its EV battery health study, analysing real world data from more than 22,700 electric vehicles across 21 makes and models. The dataset spans several years of aggregated telematics data, making it the largest and most comprehensive real world EV battery degradation analysis available.
The headline finding: the average annual battery degradation rate across the full dataset is 2.3% per year. At that rate, the average EV battery is projected to retain 81.6% of its original capacity after eight years, well above most OEM warranty thresholds of 70%.
But that average hides enormous variation, and the variation is almost entirely explained by charging behaviour.
Key finding from the study:
EVs relying heavily on DC fast charging above 100 kW (more than 40% of sessions) experienced an average annual degradation of 3.0% per year. EVs primarily using AC or lower power DC charging degraded at just 1.5% per year. The difference: 2x the degradation rate, driven entirely by charging behaviour.
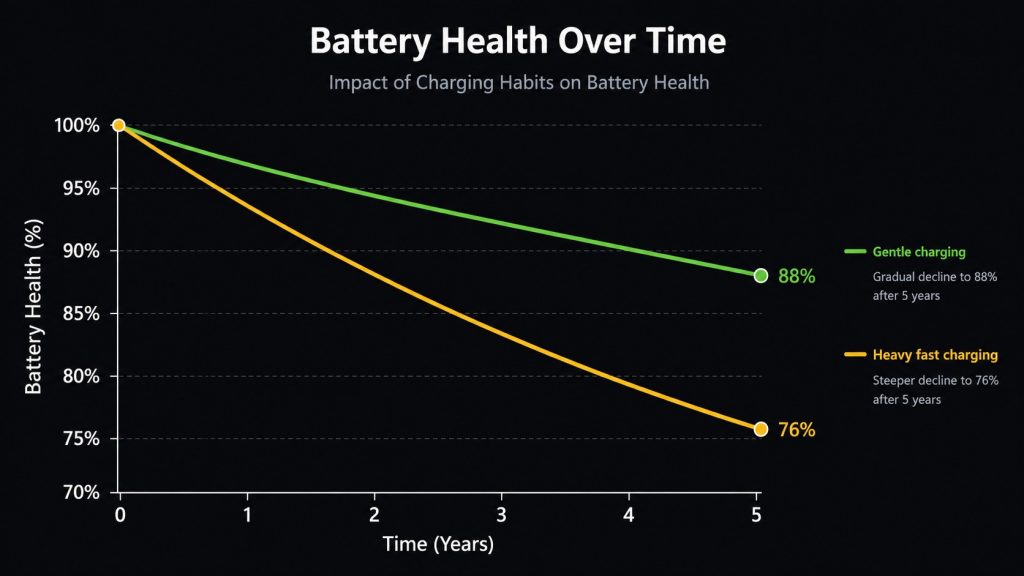
That 1.5 percentage point gap does not sound dramatic in a single year. But compound it over five years of ownership. The vehicle charged gently retains approximately 92.5% of its original capacity. The vehicle charged aggressively retains approximately 85%. Over eight years, those numbers diverge further: roughly 88% versus 76%. In a battery pack worth several lakhs, that gap translates directly into real resale value.
Cycle Count Alone Is Not Enough. The Pattern Matters.
A charge cycle is one complete discharge and recharge of the battery’s full capacity. Two partial discharges of 50% each count as one full cycle. The total cycle count tells you how many times the battery has been fully used.
The study breaks degradation by usage intensity:
Degradation by usage frequency
Low usage (one full cycle every 7+ days): 1.5% per year
Medium usage (one full cycle every 3 to 6 days): 1.9% per year
High usage (one full cycle every 1 to 2 days): 2.3% per year
The surprise in this data is how modest the gap is. High use vehicles degrade only about 0.8% per year more than low use vehicles. That means cycle count by itself is not the dominant factor. A fleet vehicle doing 250 km daily can still maintain strong battery health if it is charged correctly.
The dominant factor is how each cycle is executed. A cycle completed through slow AC charging at 7 kW, keeping the battery between 20% and 80% state of charge, generates minimal thermal stress. The same cycle completed through a 150 kW DC fast charge from 5% to 100% in a parking lot in 45 degree Celsius heat generates vastly more thermal and electrochemical stress.
Two vehicles can have identical cycle counts and completely different battery health. The cycle count tells you how much the battery has been used. The charging pattern tells you how much damage that use has caused.
The Three Variables That Actually Predict Battery Life
Based on this large scale dataset and corroborating research, three variables in the charge cycle history are the strongest predictors of remaining battery life. These are the metrics that matter far more than mileage.
Variable 1: Fast Charge Ratio
This is the proportion of total charging events that used high power DC fast charging versus slower AC charging. The study makes the relationship clear: vehicles with more than 40% of sessions using DC above 100 kW degrade at 3.0% per year. Vehicles primarily on AC degrade at 1.5%.
The mechanism is thermal. DC fast charging pushes far more current into the cells in a shorter time, which generates significantly more heat. Even with modern liquid cooled thermal management systems, the cells experience more stress per charging event. Repeated thermal cycling accelerates the formation of solid electrolyte interphase (SEI) layer growth and lithium plating, both of which permanently reduce capacity.
For a used EV buyer or resale platform, the fast charge ratio is one of the most important numbers in the vehicle’s history. A three year old vehicle with a 20% fast charge ratio has experienced fundamentally different stress than one with a 70% fast charge ratio, even if their total cycle counts are similar.
Variable 2: Depth of Discharge Pattern
Depth of Discharge (DoD) refers to how deeply the battery is drained before recharging. A DoD of 80% means the battery was used down to 20% remaining charge. A DoD of 40% means it was used down to 60%.
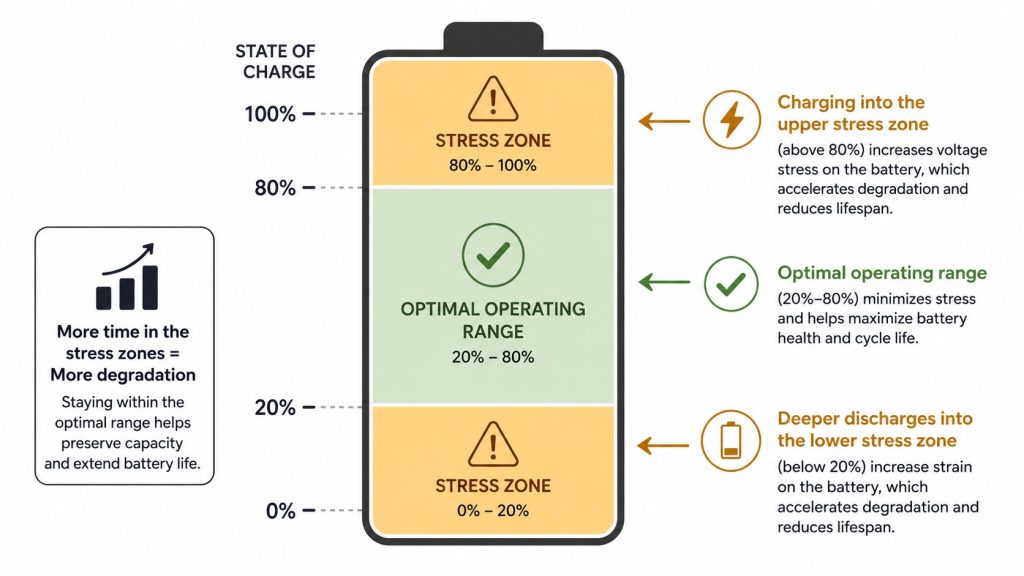
Lithium ion batteries experience more stress at the extremes of their charge range. Regularly discharging below 10% or charging above 90% places additional electrochemical stress on the cells. The optimal operating range for longevity is between 20% and 80% state of charge.
A vehicle whose DoD history shows consistent operation in the 20% to 80% range has experienced significantly less cumulative stress than one routinely run from 100% down to 5%. Over hundreds of cycles, this difference compounds.
Not sure what DoD, C rate, or SoH mean? Download our EV Battery Terminology Glossary for plain language definitions of 30+ battery terms.
Variable 3: Thermal Conditions During Charging
Temperature during charging is a multiplier on all other degradation factors. The same charging event at 25 degrees Celsius causes measurably less stress than the same event at 40 degrees Celsius. In Indian conditions, where ambient temperatures regularly exceed 40 degrees in summer across much of the country, thermal history during charging is especially significant.
The study confirms that ambient temperature is a significant factor in battery aging. A vehicle that spent three summers being fast charged outdoors in Nagpur at 45 degrees Celsius has accumulated far more thermal damage than the same vehicle charged primarily at night in an underground parking structure in Bengaluru at 28 degrees.
Most modern EVs sold in India now come equipped with liquid cooled thermal management systems that handle heat better than older air cooled models. But even liquid cooling cannot fully eliminate the accelerated degradation caused by repeated high temperature charging events.
The S Curve: Why Year 1 Looks Scary but Is Not
One pattern that frequently confuses both buyers and sellers is the shape of the degradation curve. EV battery degradation does not follow a straight line. It follows what researchers call an S curve.
In the first one to two years, there is a relatively sharp initial drop. This is normal. The battery undergoes formation processes where the SEI layer stabilises. A new EV might show 96% to 97% SoH after its first year. This is not a sign of a problem. It is expected electrochemistry.
After the initial settling period, the battery enters a long middle phase of slow, near linear decline. This is where most EVs on the road today sit. In this phase, degradation is gradual and predictable, typically 1.5% to 2.5% per year depending on charging behaviour.
Eventually, at true end of life (usually below 70% SoH), degradation accelerates again as the electrochemistry reaches its limits. But for most vehicles in the used market (three to six years old), this end of life acceleration is years away.
Understanding the S curve matters for resale valuation. A two year old vehicle showing 94% SoH is not degrading fast. It has completed the initial settling phase and entered the slow decline period. A six year old vehicle showing 82% SoH has been in the slow decline phase for years and has considerable life remaining.
Two Vehicles, Two Stories: A Hypothetical Comparison
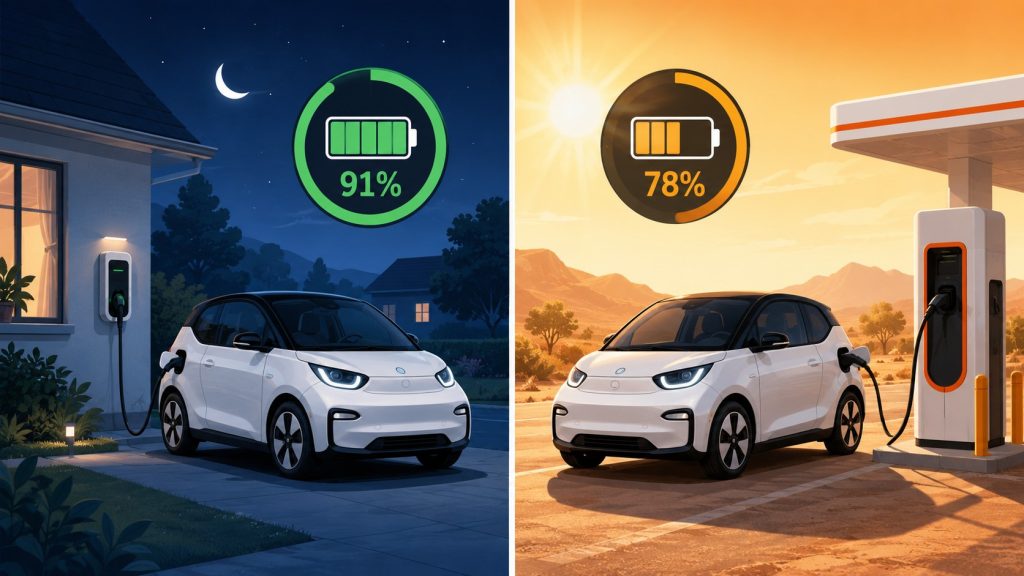
To illustrate how charge cycle history predicts battery life, consider two hypothetical electric compact SUVs of the same make and model, both purchased new in January 2023, both with 38,000 km on the odometer in July 2026.
Vehicle A: The Gentle Charger
Total charge cycles: 420
Fast charge ratio: 15% (mostly home AC at 7 kW)
Typical DoD: 25% to 85% (60% depth per cycle)
Parking: covered garage, Pune (avg 28°C summer)
Current SoH: 91%
Projected SoH at year 8: 86%
Vehicle B: The Fleet Workhorse
Total charge cycles: 780
Fast charge ratio: 65% (daily DC fast charges at 50 kW)
Typical DoD: 5% to 100% (95% depth per cycle)
Parking: open lot, Nagpur (avg 42°C summer)
Current SoH: 78%
Projected SoH at year 8: 68% (approaching EOL)
Same vehicle. Same age. Same mileage. A 13 percentage point difference in battery health, driven entirely by how the battery was charged and where the vehicle was parked.
On a used car platform today, these two vehicles would be listed at similar prices because the listing shows the same model, year, and odometer reading. Without charge cycle data, the buyer has no way to distinguish between them. The seller of Vehicle A gets undervalued. The buyer of Vehicle B gets a nasty surprise. And the platform loses trust.
This is exactly the problem that Navionyx EV Resale Value Intelligence solves. By capturing the full charge cycle history from first deployment, Navionyx differentiates these two vehicles with data, not guesswork.
What This Means for Used EV Pricing
The implications for anyone involved in the used EV market are direct.
For resale platforms: Mileage based pricing models systematically misprice EVs. A vehicle with 50,000 km and gentle charging is worth significantly more than one with 50,000 km and aggressive charging. Without charge cycle data feeding into your pricing algorithm, you are leaving money on the table on well maintained vehicles and overpaying for abused ones.
For dealerships: Charge cycle history is the single most important datapoint to add to your used EV inspection process. Our EV battery inspection checklist walks through exactly how to evaluate charging patterns alongside the other eight critical checks.
For NBFC and insurance analysts: Loan to value ratios and insurance premiums for used EVs should incorporate charge cycle data. A vehicle with documented gentle charging history has a measurably lower risk profile than one with heavy fast charging usage. The data from 22,700+ vehicles supports this differential.
For individual buyers: Before you buy a used EV, ask for the charge cycle history. If the seller cannot provide it, that absence of data is itself information. A vehicle monitored through a platform like Navionyx from first deployment will have a complete, verifiable charging history captured in the Navionyx EV Certificate.
The Cell Level Story Behind the Cycle Data
Charge cycle history tells you how the battery was treated. Cell level data tells you how the battery responded.
A battery pack contains dozens or hundreds of individual cells. In a healthy pack, all cells operate at nearly identical voltages and charge states. As a pack ages through charge cycles, individual cells can begin to drift apart. One cell might hold 3.82V while the rest hold 3.95V. The BMS compensates by limiting the entire pack’s output to match the weakest cell.
The result: the pack’s effective usable capacity is lower than the overall SoH number suggests. A vehicle showing 85% SoH but with significant cell variance might effectively behave like a 78% SoH pack because the weakest cells are throttling the whole system.
This is why SoH alone, without charge cycle context and cell level data, gives an incomplete and sometimes misleading picture. We explored this in detail in One Cell Is Lying to You: Here Is How We Know.
The Navionyx platform captures both layers. The charge cycle history shows how the battery was used. The cell level analytics show how the battery is actually performing at a granular level. Together, they give the most accurate prediction of remaining battery life available.
The Bottom Line
Charge cycle history is to EV batteries what service records are to ICE engines. It is the dataset that separates a vehicle worth buying from one that should be priced at a significant discount. The difference is that charge cycle data is far more predictive than an oil change log.
The data from 22,700+ vehicles is unambiguous. Charging behaviour is now the biggest single factor in battery degradation, ahead of age, ahead of mileage, and ahead of ambient temperature. Vehicles charged gently on AC retain their capacity at roughly half the degradation rate of those charged aggressively on DC.
For anyone buying, selling, financing, or insuring a used EV, access to verified charge cycle data is no longer a nice to have. It is the foundation of accurate valuation. And that is precisely what the Navionyx EV Certificate provides.
See What a Navionyx EV Certificate Looks Like
Download a sample battery health report showing charge cycle analysis, cell level diagnostics, degradation trends, and the overall resale readiness score.
Download Sample ReportRelated Reading
One Cell Is Lying to You: Here Is How We Know
EV Battery Health Is More Than SoH: How Cell Level IoT Analytics Reveal the Real Story
This article references data from a large scale EV battery health study published in January 2026, covering 22,700+ vehicles across 21 makes and models. It was researched and written with AI assistance and reviewed by the Navionyx team.