Battery Intelligence · Fleet Finance · Real Vehicle Data
A vehicle with 226 charge cycles, 3,535 km on the odometer, and a State of Health of 33%. This article walks through what that number costs every stakeholder in the lease chain — and what Indian EV finance cannot afford to keep ignoring.
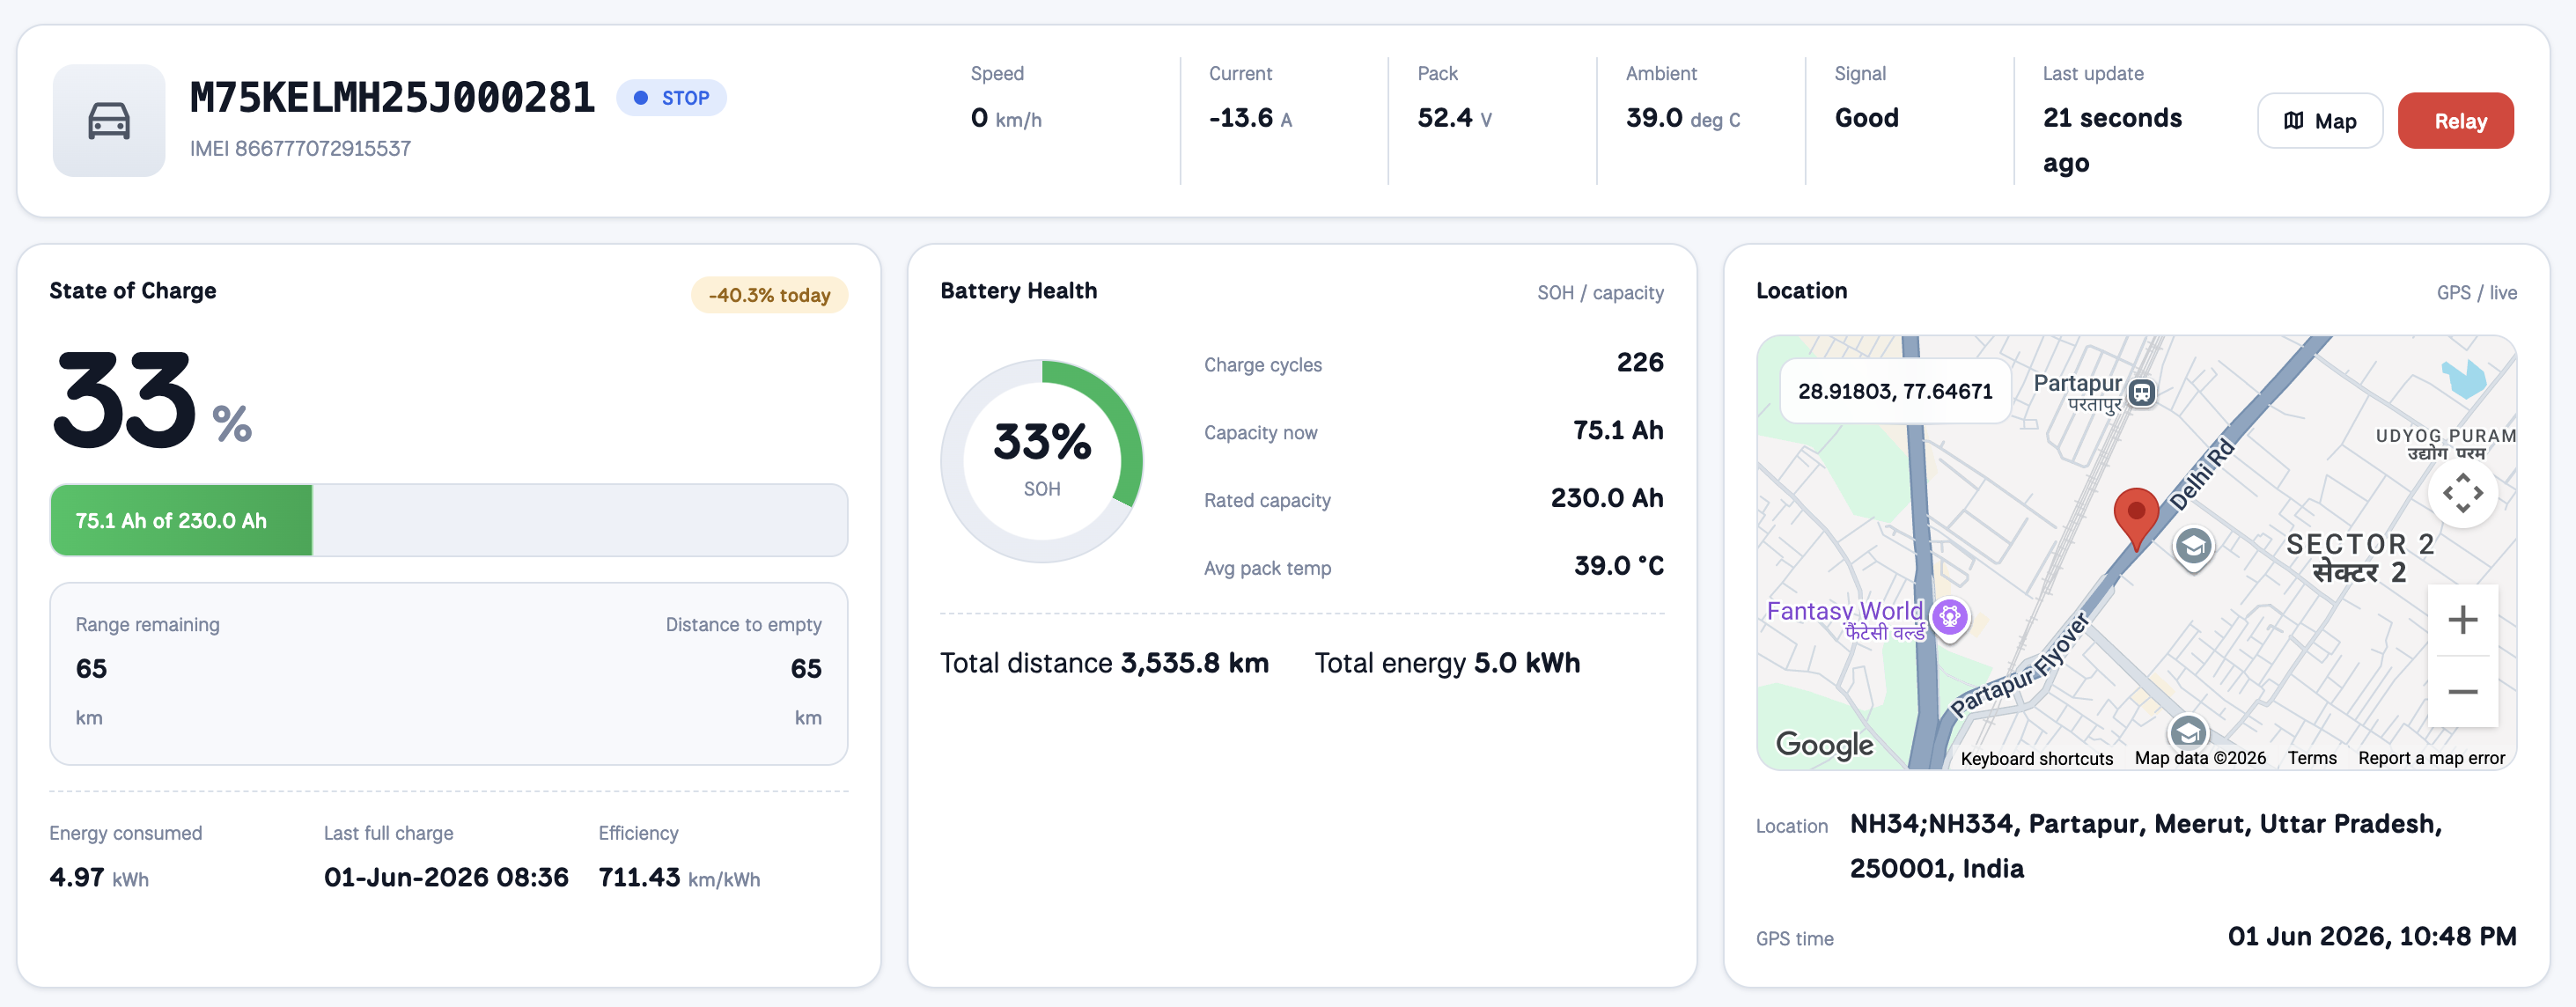
The vehicle is parked. The telematics signal is green. The fleet platform shows it active, connected, and logging data exactly as it should. Trips logged: 3,339. Total distance covered: 3,535 km. Energy consumed: within normal range. To any fleet manager reviewing the live map, this vehicle is doing its job.
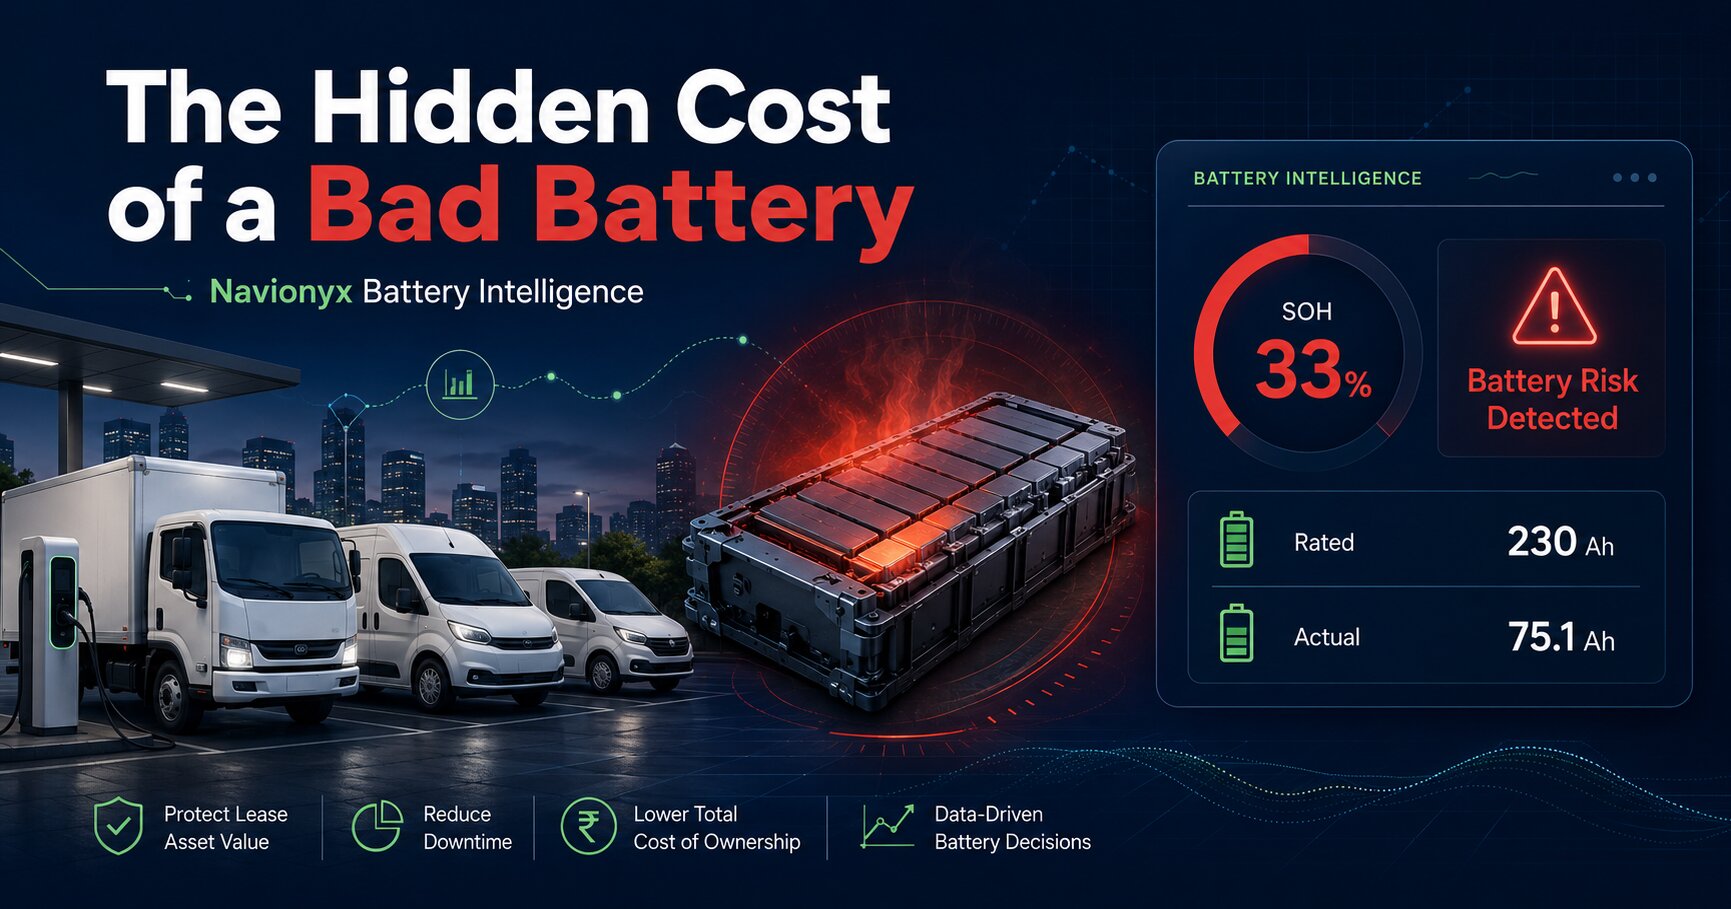
Open the battery intelligence dashboard and one number reframes everything. State of Health: 33%.
This is a real vehicle monitored on the Navionyx platform, operating in northern India. Its rated battery capacity is 230 Ah. The capacity actually available today is 75.1 Ah. Over the course of its operating life, this vehicle has lost 154.9 Ah of usable energy storage. That is not a minor degradation footnote in a technical report. That is 67 percent of the battery’s designed capacity, gone, and with it, a proportional collapse in the vehicle’s range, residual value, and viability as a financed fleet asset.
If this vehicle sits in a leased fleet, the lender who financed it did not underwrite 75.1 Ah. They underwrote 230 Ah. And unless someone is continuously watching the data, nobody knows the difference until the vehicle is returned at lease-end and is worth a fraction of what was assumed when the loan was sanctioned.
This article is about that gap. What causes it, what it costs in real rupees across the lease chain, and why the Indian EV finance ecosystem cannot keep scaling without solving it.
The Battery Is the Loan Collateral. And Nobody Is Watching It.
In any electric vehicle, the battery pack is not just a component. It is the primary determinant of the vehicle’s value, its range capability, its residual worth at resale, and its viability as a financed asset across the full lease tenure. Research consistently places the battery pack at 30 to 50 percent of a new EV’s total cost. In India, mid-range electric four-wheelers carry packs sized between 30 and 40 kWh. A full battery replacement in 2026 costs between Rs 15,000 and Rs 22,000 per kWh depending on chemistry, which translates to Rs 1.5 lakh on the low end and Rs 7 lakh or more for larger commercial or premium packs. For a popular mass-market electric SUV alone, confirmed authorized service centre quotes in 2026 place that replacement between Rs 5.5 lakh and Rs 7 lakh.
When a lender, whether a bank or an NBFC, finances an EV for a fleet operator, they are writing a loan against this battery as the core collateral. The chassis depreciates on a predictable curve. The battery does not. It degrades based on a complex combination of operating temperature, charging behavior, depth of discharge, charge cycle frequency, and the underlying cell chemistry — none of which appear in any standard vehicle document handed over at origination.
This is the structural fault line in Indian EV fleet financing. The market is growing at a pace the risk assessment infrastructure was not built to handle. India’s EV financing market, estimated at USD 2.37 billion in 2025, is projected to reach USD 28.79 billion by 2031, a 51.62% CAGR. Operating leases alone are expanding at 53.47% CAGR over the same period, because fleet operators have found them the only viable way to avoid absorbing residual value risk themselves. They push that risk upstream to the lessor. And the lessor, in the majority of cases, has no real-time visibility into what is happening to the battery mid-tenure.
“The lender financed 230 Ah. The vehicle is delivering 75.1 Ah. That is not a warranty conversation. It is a portfolio risk that has already crystallized, silently, inside the lease tenure.”
About 50 percent of commercial EV fleet operators in India now choose the leasing model, according to industry analysis. The collapse of a prominent EV ride-hailing fleet operator in 2025 gave lenders a stark preview of what happens when EV portfolio risk is not properly underwritten: financiers were left scrambling to recover between 1,500 and 2,000 financed EVs with uncertain market values and no standardized methodology to assess their battery condition before resale. The vehicles existed. The data to value them properly did not.
The Indian EV fleet market does not have a scale problem. It has a visibility problem.
When 33% Becomes Real Money
Abstract degradation percentages are easy to dismiss. Real rupees are not. Let us work through what the data from this specific vehicle actually means in financial terms, at every level of the lease chain.
Real Vehicle Data: Navionyx Platform
State of Health
33%
Rated Capacity
230.0 Ah
Actual Capacity Today
75.1 Ah
Capacity Lost
154.9 Ah (67%)
Charge Cycles
226
Total Distance
3,535.8 km
Range Remaining
65 km
Avg Pack Temp
39.0°C
SOC Drop (Single Day)
40.3%
Source: Navionyx platform, real fleet vehicle, northern India, June 2026. Vehicle identifiers anonymized.
At 33% SOH, this vehicle is operating on a third of its designed energy capacity. Its effective range has collapsed proportionally. With a current SOC of 33% and 65 km of range remaining on the platform at last reading, this vehicle is delivering a fraction of the range it was specified to provide. For a fleet deployment where route economics are calculated on a defined daily range assumption, this is not a minor inconvenience. It is an operational failure hiding inside what looks like a normal telematics report.
The financial position is equally direct. At Indian market pricing of Rs 15,000 to Rs 22,000 per kWh in 2026, a battery pack of the capacity implied by a 230 Ah rated rating would cost lakhs to replace. If this vehicle was leased with the assumption that the battery would retain reasonable SOH across a standard three-year tenure, the lender is now holding an asset whose primary value driver has effectively gone through a near-total collapse. That is not a depreciation haircut. It is a write-off event that nobody saw coming because nobody was looking.
The lender’s exposure does not stop at replacement cost. When a vehicle with 33% SOH enters the used market at lease-end, its resale value depends entirely on what a buyer can independently verify about battery condition. In a secondary market where standardized battery health data is still not the norm, most used EV buyers apply a blanket discount that penalizes every vehicle regardless of actual battery status. The lender absorbs that discount. And if no one was monitoring the battery during the tenure, the lender has no documentation to challenge it. The vehicle’s battery history is a black box. The negotiation is lopsided from the start.
226 Charge Cycles Should Not Look Like This
The context that makes this vehicle’s data alarming is not just the 33% SOH in isolation. It is the 33% SOH relative to how many cycles this battery has actually completed.
226 charge cycles is not a high number. For a commercial vehicle charging daily, it represents roughly seven to eight months of operation. Geotab’s 2025 analysis of over 22,700 electric vehicles across 21 different models, one of the most comprehensive real-world EV battery studies published to date, found that the average battery degradation rate across modern EV fleets is 2.3% per year. At that benchmark, a battery completing 226 cycles over approximately eight months of operation should be sitting comfortably above 80% SOH. Well-maintained packs from quality manufacturers would typically be at 90% or higher at this stage in their lifecycle.
This vehicle is at 33%.
The gap between where this battery should be and where it is points unambiguously to accelerated degradation driven by factors beyond normal cycle wear. In our experience tracking battery health across fleet deployments, three patterns consistently produce this kind of early-stage capacity collapse. The first is sustained high operating temperature. The second is aggressive charging behavior, particularly repeated charging to high state-of-charge levels followed by deep discharge cycles. The third is underlying cell quality issues that compound across cycles. In this vehicle’s case, the 24-hour temperature data provides a specific and measurable lead.
Temperature Is the Silent Killer in Indian EV Fleets
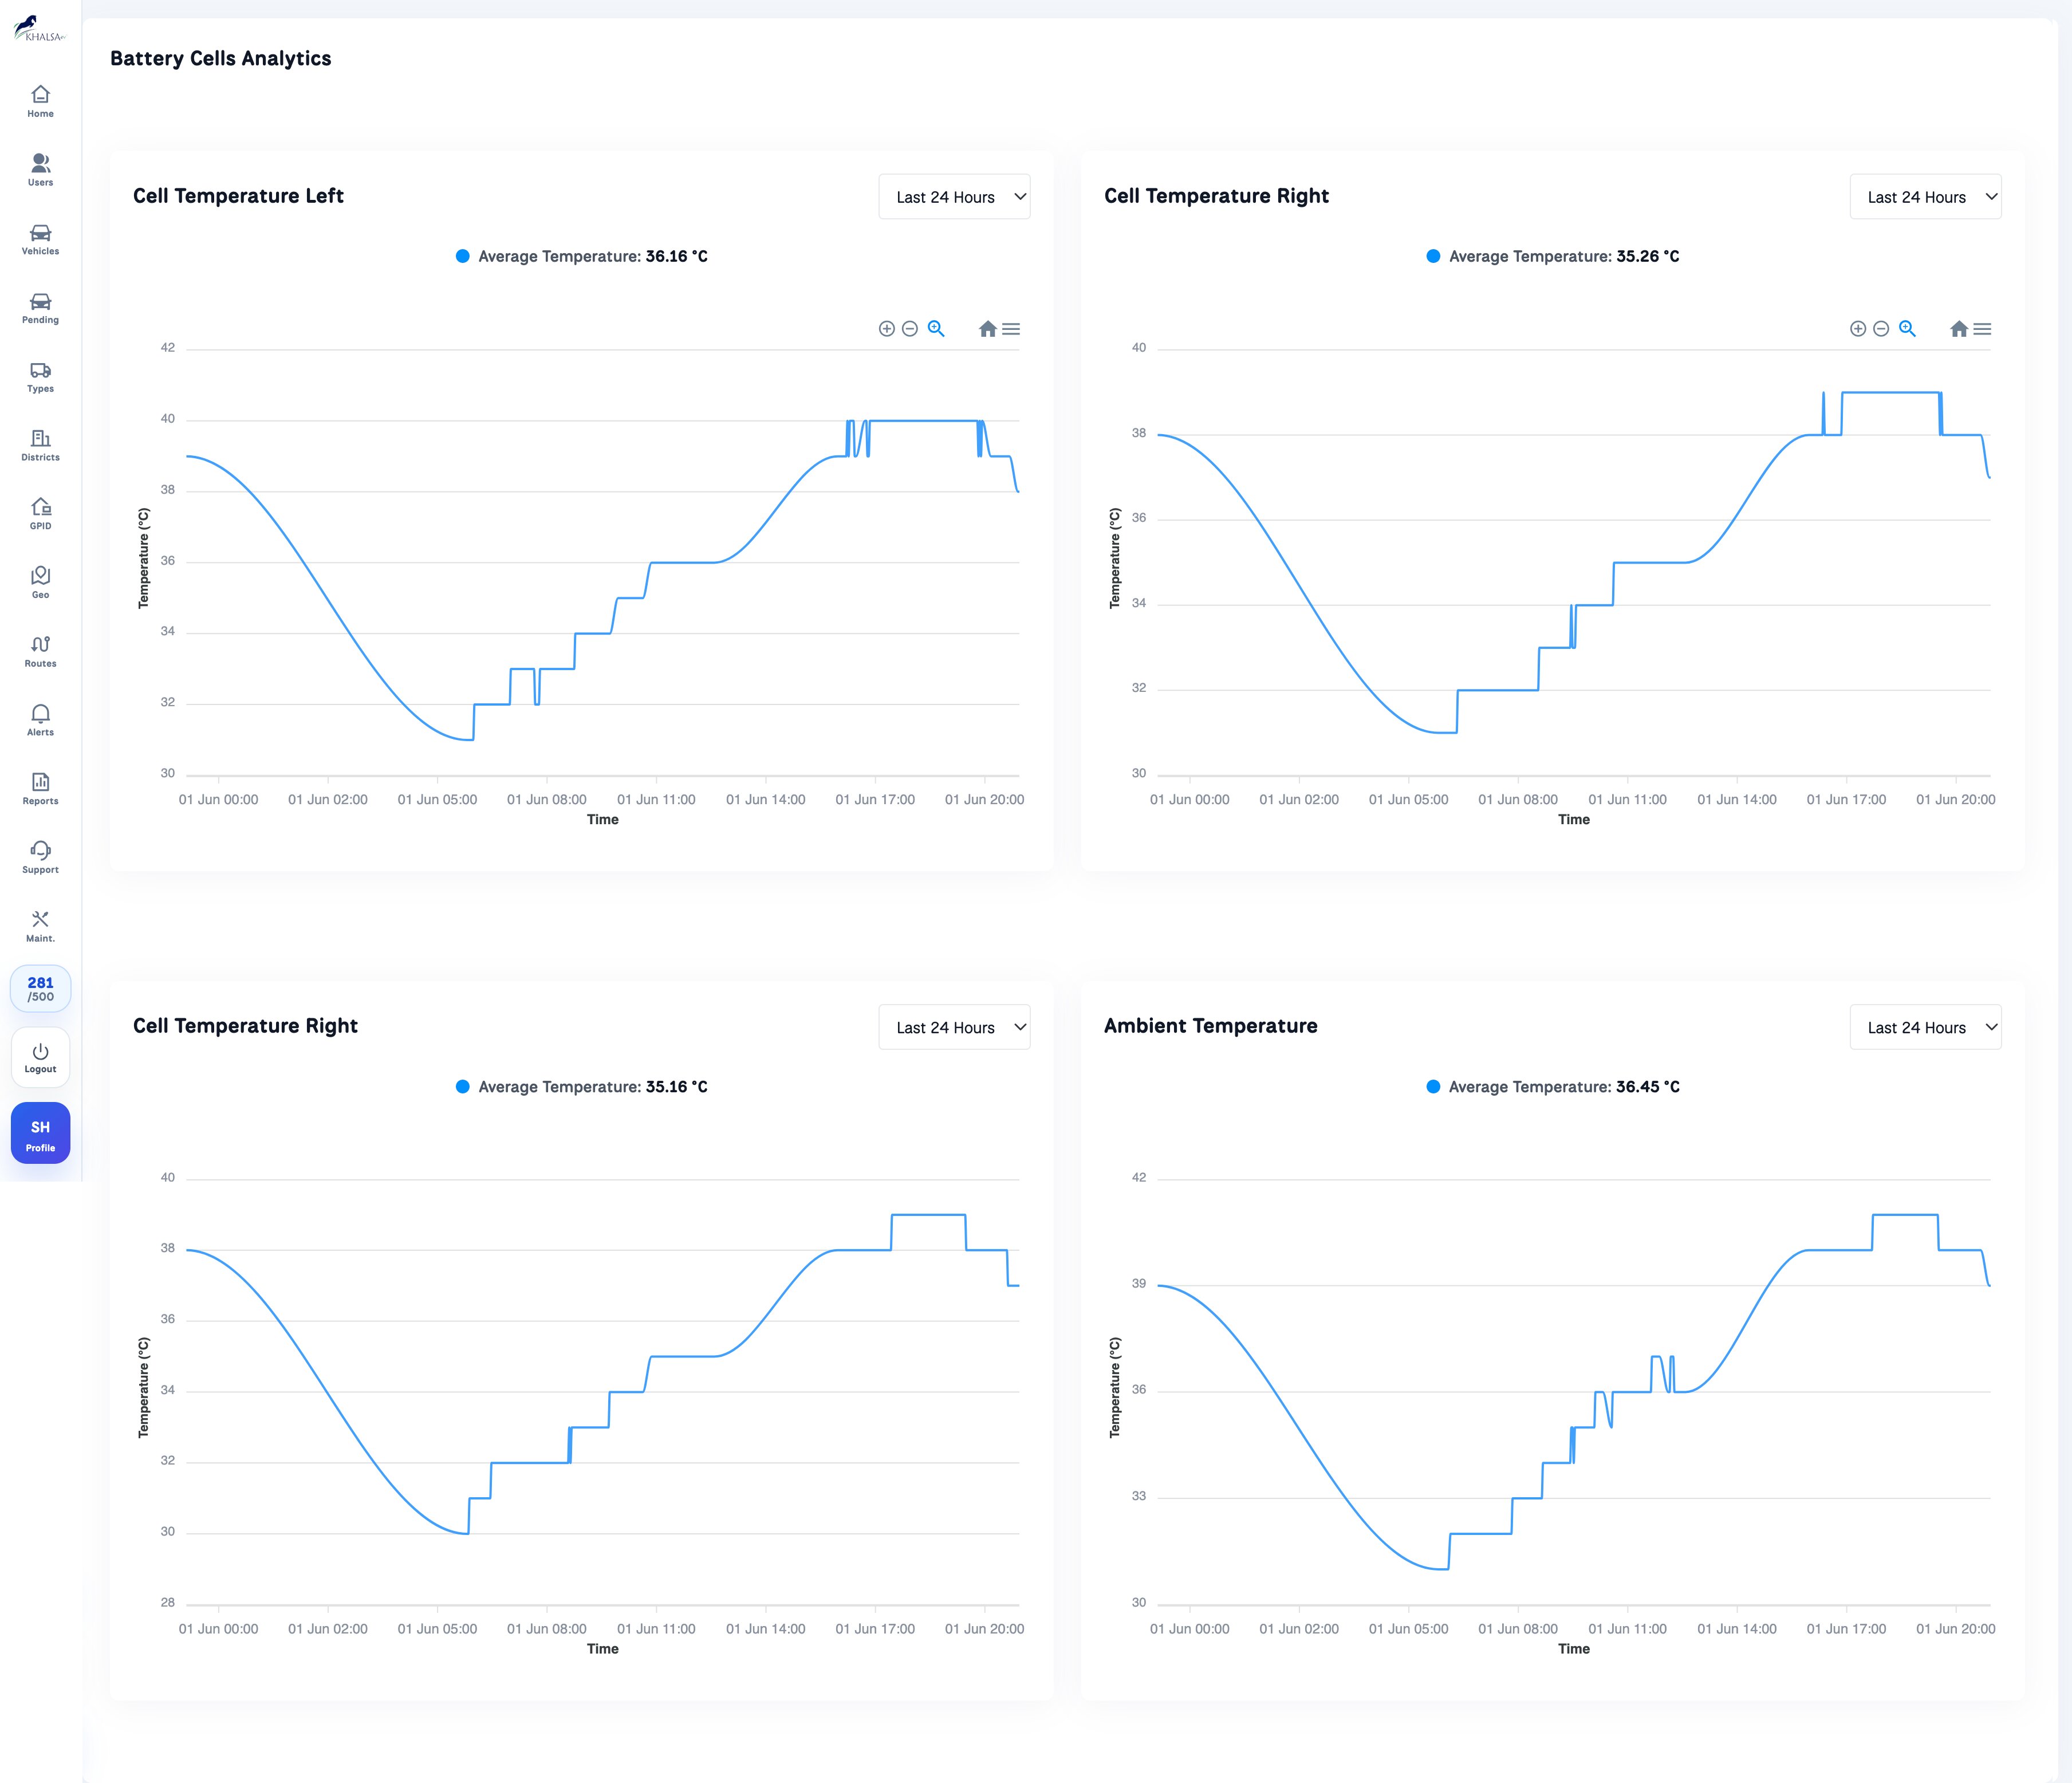
The 24-hour battery temperature data captured from this vehicle’s dashboard tells a story that fleet managers almost never see assembled in one place. Over a single full operating day, the left cell bank averaged 36.16°C, the right cell bank averaged 35.26°C, and the ambient temperature surrounding the pack averaged 36.45°C. During peak afternoon operation, cell temperatures climbed as high as 40°C before cooling gradually through the evening idle period.
Battery Temperature Data: 24-Hour Window (01 June 2026)
Cell Temp Left (avg)
36.16°C
Cell Temp Right (avg)
35.26°C
Ambient Temp (avg)
36.45°C
Peak Cell Temp Recorded
40.0°C
Avg Pack Temp
39.0°C
Hottest Individual Cell
38.0°C
Source: Navionyx battery cell temperature dashboard, real fleet vehicle, northern India, June 2026
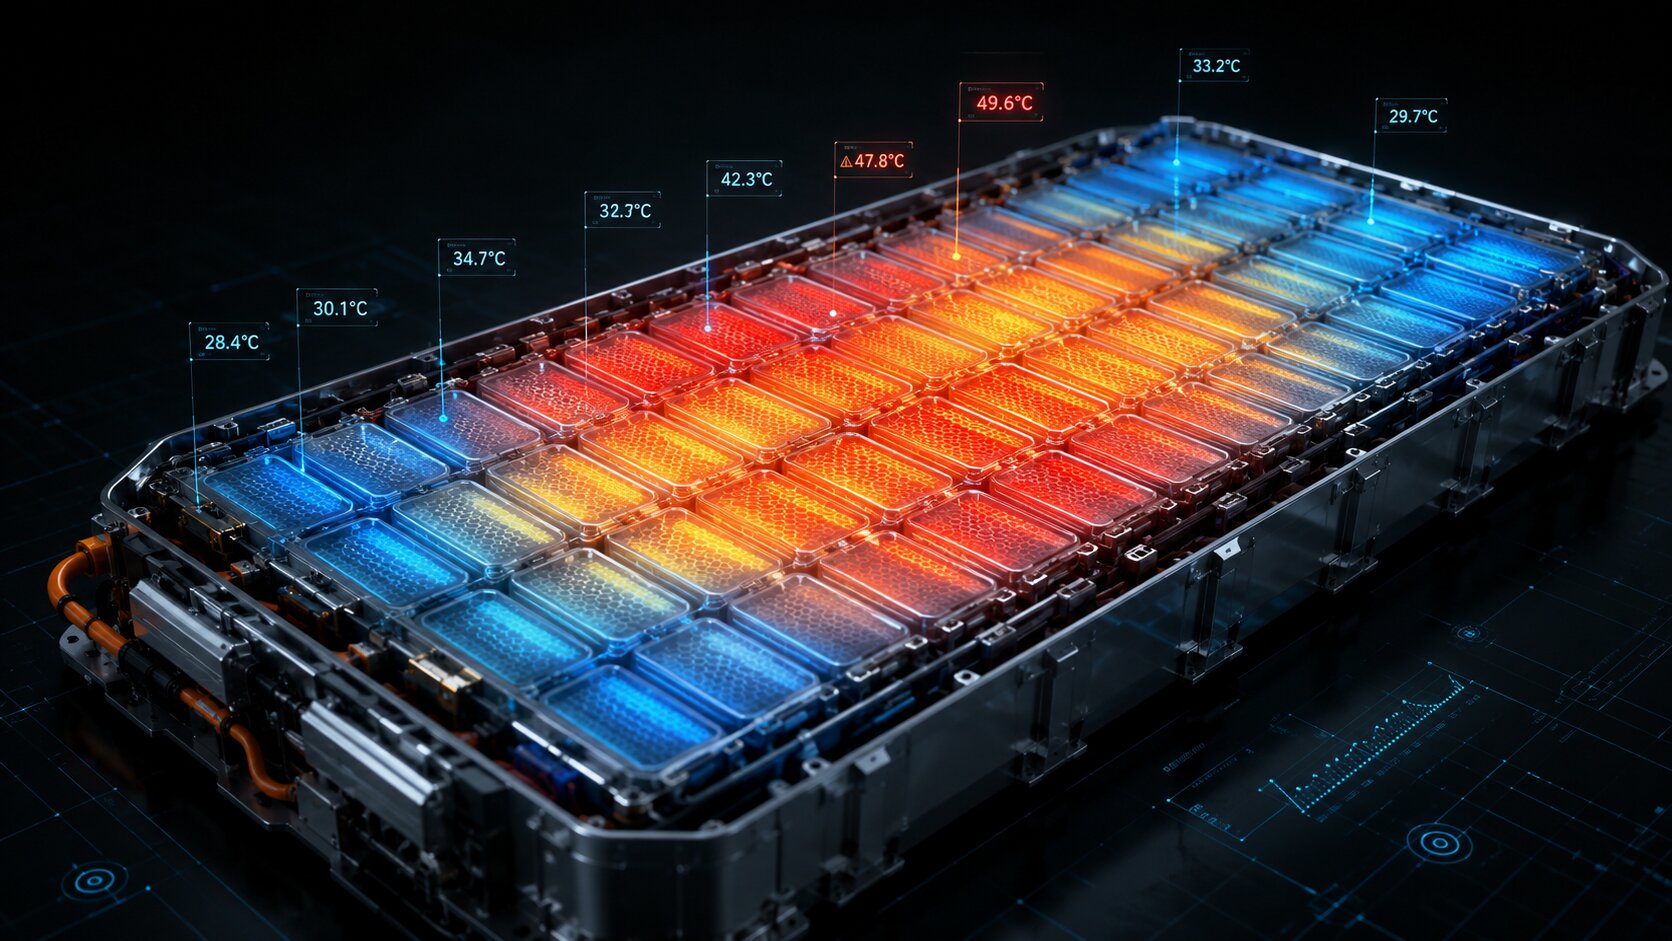
These temperatures sit in a range that battery chemistry research has consistently identified as an accelerated degradation zone. Lithium-ion batteries perform best and age most slowly between 15°C and 25°C. Above 35°C, the growth rate of the solid-electrolyte interface layer on the anode increases substantially. The SEI layer is an irreversible byproduct of the electrochemical reactions inside every lithium-ion cell. As it thickens cycle by cycle, it consumes lithium inventory, raises internal resistance, and permanently reduces the pack’s usable capacity. There is no way to reverse SEI growth. Once the lithium is consumed in forming that resistive layer, it is lost.
Published electrochemical research on widely-studied lithium-ion cell references puts the real-world degradation premium at elevated temperatures in stark terms. Operating a battery consistently at 40°C reduces its cycle life by approximately 40% compared to operation at 20°C. Batteries exposed regularly to 45°C experience more than double the capacity fade of cells maintained at 25°C. A battery completing 200 cycles at 45°C loses roughly twice the capacity of an equivalent battery at 25°C over the same cycle count.
India’s climate conditions, combined with the thermal environment inside densely packed commercial vehicle battery enclosures running on summer afternoons, routinely push operating temperatures into this damage zone. The vehicle in this study is not an edge case. Its thermal profile, cells running between 36°C and 40°C during afternoon operation with an ambient of 36.45°C, is representative of what any fleet vehicle operating in northern or western India will experience during the warmer months of the year.
What makes this particularly costly for fleet operators and their lenders is that the thermal stress is invisible without the right monitoring layer. A driver does not feel the battery overheating during a routine delivery. A fleet manager reviewing end-of-day trip reports sees kilometers covered and energy consumed. Neither party sees the cumulative thermal damage that is compressing the battery’s remaining useful life, session by session, week by week, until the range is suddenly short and the asset has lost most of its value.
“A driver does not feel the battery degrading at 38°C. A fleet manager reviewing trip reports sees distance and energy. Neither party sees the cumulative thermal damage quietly compressing the battery’s remaining useful life, session by session.”
The 24-hour temperature trend from this vehicle shows a pattern we have observed across multiple fleet deployments in India. Cells cool during early morning idle hours, climb steadily through morning operation, peak in the afternoon heat, and then stabilize at elevated levels through the evening. This is not an exceptional profile. It is the standard thermal lifecycle of a commercial EV without active thermal monitoring. When it repeats across hundreds of cycles in Indian summer conditions, the outcome is accelerated capacity loss that looks like a battery quality problem but is, in reality, a visibility problem.
Why the Indian EV Finance Sector Cannot Absorb This Risk Much Longer
India’s EV leasing market reached USD 1.19 billion in 2025 and is projected to grow to USD 5.33 billion by 2030, a 34.97% CAGR. Corporate fleets hold 47.82% of that market. The broader EV financing market is expected to reach USD 28.79 billion by 2031, growing at 51.62% annually. These are not niche figures. This is a mainstream credit market that is scaling at a velocity the risk assessment infrastructure has not caught up with.
The financing challenge is well documented within the industry. Banks and NBFCs have been reluctant to underwrite commercial EV assets at standard loan-to-value ratios because the residual value of an EV at lease-end is determined primarily by the battery’s condition, and there has historically been no standardized, independently verifiable way to assess that condition. As a consequence, NBFCs have priced commercial EV loans at 1 to 7 percent higher than equivalent ICE vehicle loans. That premium is not a reflection of EV operating economics, which are genuinely better than ICE vehicles in most commercial applications. It is a risk surcharge that gets applied because the lender does not know what the battery will look like in three years, and cannot verify what it looked like when the loan was sanctioned.
India EV Finance: The Scale of the Exposure
EV Finance Market by 2031
USD 28.79 Billion
Market CAGR (2026 to 2031)
51.62%
EV Leasing Market (2030)
USD 5.33 Billion
Corporate Fleet Market Share
47.82%
Commercial Operators on Leases
~50%
NBFC Premium Over ICE Loans
1% to 7% higher
Battery as % of EV Cost
30% to 50%
Battery Replacement (India, 2026)
Rs 15,000 to Rs 22,000 per kWh
Avg Degradation (22,700 EVs)
2.3% per year (Geotab, 2025)
Sources: industry research firms, fleet analytics providers, and trade publications, 2024 to 2026
The risk accumulation pattern is predictable. A lender originates a fleet lease without a verified battery baseline. The battery degrades faster than expected, driven by thermal conditions and charging patterns the lender has no visibility into. The fleet operator experiences range reduction but keeps operating the vehicle because it is still making trips. At lease-end, the vehicle comes in for return assessment. The lender discovers that the residual value model built at origination was based on assumptions about battery health that never materialized. There is no mid-tenure alert in the record. There is no documentation of when the degradation began or what caused it. There is just an asset worth significantly less than what was underwritten.
A note from Growth Jockey on the EV financing landscape makes the systemic point clearly: until standardized battery health certificates and residual value benchmarks are developed, financing risk in the Indian EV market will remain structurally elevated. Separate analysis on India’s EV leasing market takes this further, noting that when battery health analytics and standardized resale channels improve, they create a compounding benefit: better risk pricing leads to better lease terms, which leads to faster EV adoption, which generates more battery performance data, which further sharpens residual value models. The entire flywheel runs on one thing: real battery data, continuously captured and independently verified.
That data infrastructure is not theoretical. It exists today.
What Continuous BMS Monitoring Actually Shows
The vehicle at the center of this article was not invisible to its data layer. Every number shared in this article came from the Navionyx platform, reading the vehicle’s BMS output in real time. The 33% SOH is not a discovery made at repossession. It is on the fleet dashboard today, with a timestamp, a trend line across the battery’s operating history, and a session-by-session SOC delta report that documents exactly when and how capacity changed over time.
That distinction is the entire argument for continuous monitoring. It does not just give you a number. It gives you the context behind the number, the ability to act before a loss crystallizes into a financial event, and the documentation to anchor any warranty, resale, or insurance conversation in verified evidence.
On a single operating day, the platform captured the following for this vehicle. The SOC history shows the battery starting at approximately 73% at 7:00 AM, climbing briefly to around 83% after a short charge session, then declining progressively through the afternoon to below 40%, recovering partially, then falling again to 33% by evening. The total SOC depletion across the day was 40.3%. Twelve discrete SOC report entries were logged for that single day, each recording exact session duration, starting SOC, ending SOC, delta SOC, distance covered, and energy efficiency per Ah. This is not a daily summary. It is a minute-by-minute operational record that gives a fleet manager or lender the ability to reconstruct exactly what the battery went through on any given day.
Cell-Level Intelligence: What the Dashboard Captures
Total Cells Monitored
16 cells
Voltage Spread (Pack dV)
10 mV
Min Cell Voltage
3.280 V
Max Cell Voltage
3.290 V
Balance Status
Balanced
Avg Cell Temp
37.5°C
SOC Sessions Logged (1 Day)
12 entries
Trips Logged (Lifetime)
3,339
Total Charge Sessions
226
Source: Navionyx platform, real fleet vehicle, northern India, June 2026
The cell voltage data is equally informative. Across all 16 individual cells, the voltage spread on the monitored day was just 10 millivolts, with the minimum cell at 3.280V and the maximum at 3.290V. The balance status is flagged as Balanced. This tells us something important: the degradation in this pack is not a cell imbalance problem. It is not one weak cell pulling the pack’s effective capacity down. The entire pack has degraded uniformly. That points back to thermal and operational stress being applied to the battery as a whole, rather than a localized manufacturing defect. The pack chemistry has aged together, which makes the cause more likely environmental than structural.
For a leasing company or NBFC managing a portfolio of 50 to 500 vehicles, this level of data visibility creates something that currently does not exist in most fleet finance portfolios: an asset health register. Every vehicle has a documented battery condition timeline from origination through each operating period. Warranty claims can be supported with evidence. Resale conversations can be anchored in verified data rather than negotiation estimates. Risk pricing can shift from reactive premium charging to proactive portfolio management based on actual SOH trends across the fleet.
The practical difference between catching a battery at 70% SOH and discovering it at 33% is not just a matter of degree. At 70%, an intervention is possible. Charging pattern adjustments, route optimization to reduce thermal load, or a warranty escalation with the manufacturer are all live options. At 33%, the options narrow to replacement or write-off. The cost difference between those two outcomes, measured in both rupees and residual value, is substantial.
What a Verified Battery Looks Like Before It Enters Your Fleet
Continuous monitoring solves the in-tenure visibility problem. But there is an equally important question that precedes it: what was the battery’s actual condition on the day the vehicle entered the lease book?
In most fleet lease originations in India today, the answer to that question is: unknown. The vehicle arrives with a dashboard SOH reading, a manufacturer specification sheet, and an odometer number. None of those three sources provide an independently measured, verified baseline of what the battery can actually deliver under real operating conditions. A dashboard SOH figure is self-reported by the vehicle’s BMS using the manufacturer’s algorithm. It is useful, but it is not an independent audit. It does not tell you how the voltage responds under load, how the cells balance under real discharge conditions, what BMS fault codes exist in the system, or what thermal behavior the pack demonstrates during an actual drive cycle.
This is the gap that a structured battery certification process fills. At Navionyx, we measure eight distinct battery health signals through a combination of plug-and-play BMS data capture and a guided test drive protocol. The eight signals are: State of Health as a percentage, usable capacity in kWh, voltage response behavior under load, cell balance across the full pack, thermal stability across the test drive, BMS fault code and warning code status, regen response during deceleration, and estimated real-world range based on observed energy consumption. Together, these signals produce a QR-verifiable Battery Intelligence Certificate that reflects the battery’s actual measured performance, not the manufacturer’s specification or the BMS’s self-assessment.
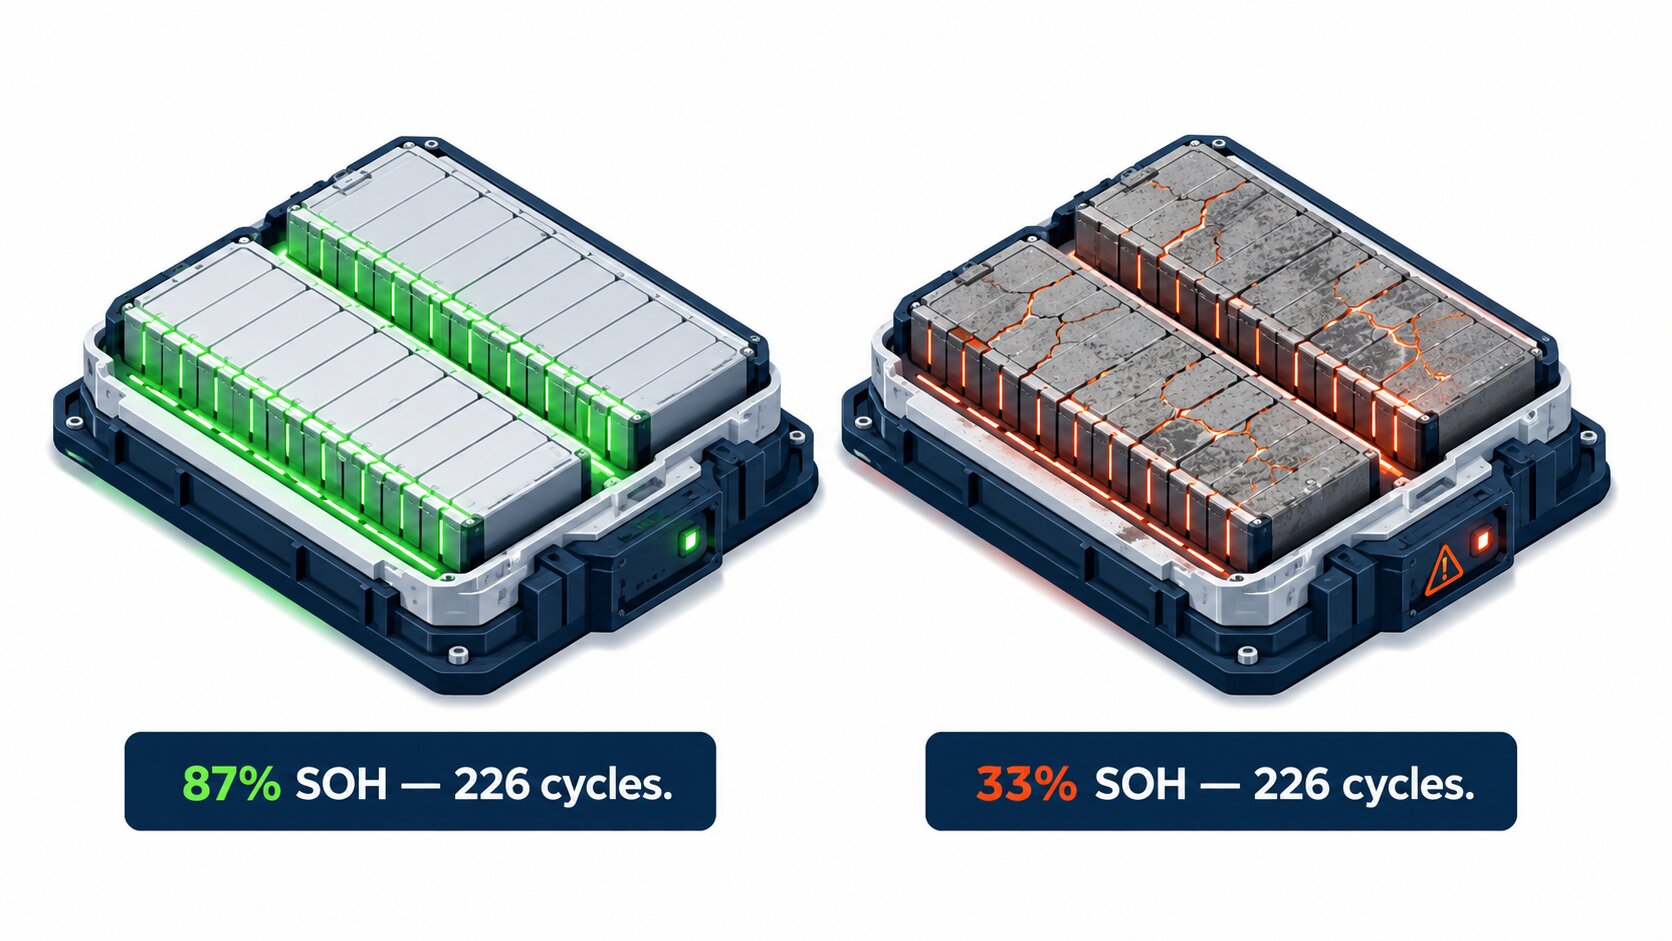
The Difference Certification Makes
Without Certification at Entry
SOH: 33% — discovered after tenure
Actual capacity: 75.1 Ah (unknown at origination)
Effective range: ~65 km
BMS baseline: None on record
Resale documentation: None
Residual value: Disputed at return
Navionyx Certified at Entry
SOH: 87% — verified before lease begins
Usable capacity: 34.8 kWh — independently measured
Estimated range: ~250 km
BMS faults: None — confirmed clean
Certificate: QR-verifiable, unique ID
Residual value: Anchored in verified data
For finance companies, a Navionyx Battery Intelligence Certificate functions as a loan-grade battery health document. It provides the verified baseline that LTV models in the Indian EV leasing market have been unable to anchor with any consistency. For fleet operators, it serves as a clean opening audit against which mid-tenure degradation captured by continuous monitoring can be measured and compared. For resale platforms and used EV buyers, it resolves the single most persistent friction point in every used EV transaction: the question of how healthy the battery actually is, answered with independently measured data and a scannable certificate anyone can verify.
The outcome data from Navionyx’s certification platform shows that verified vehicle listings close 38% faster than unverified ones, command a demonstrable premium at resale, generate 92% higher buyer trust scores, and produce 65% fewer post-sale disputes. These are not theoretical projections. They are the direct financial outcome of replacing “trust the seller’s word” with “verify the battery’s data.” The average test takes 30 minutes. The certificate carries a unique ID, a QR code linked to an independent verification page, and a digital signature. It is shareable instantly to any buyer, lender, insurance underwriter, or fleet valuation team that needs a credible record of battery condition.
Know the true value of your battery before you commit to the next lease, valuation, or resale.
A Navionyx Battery Intelligence Certificate gives you eight independently measured signals, a QR-verifiable document, and a verified opening baseline — before the vehicle enters your fleet, not after it leaves.
Get Your Battery Certified →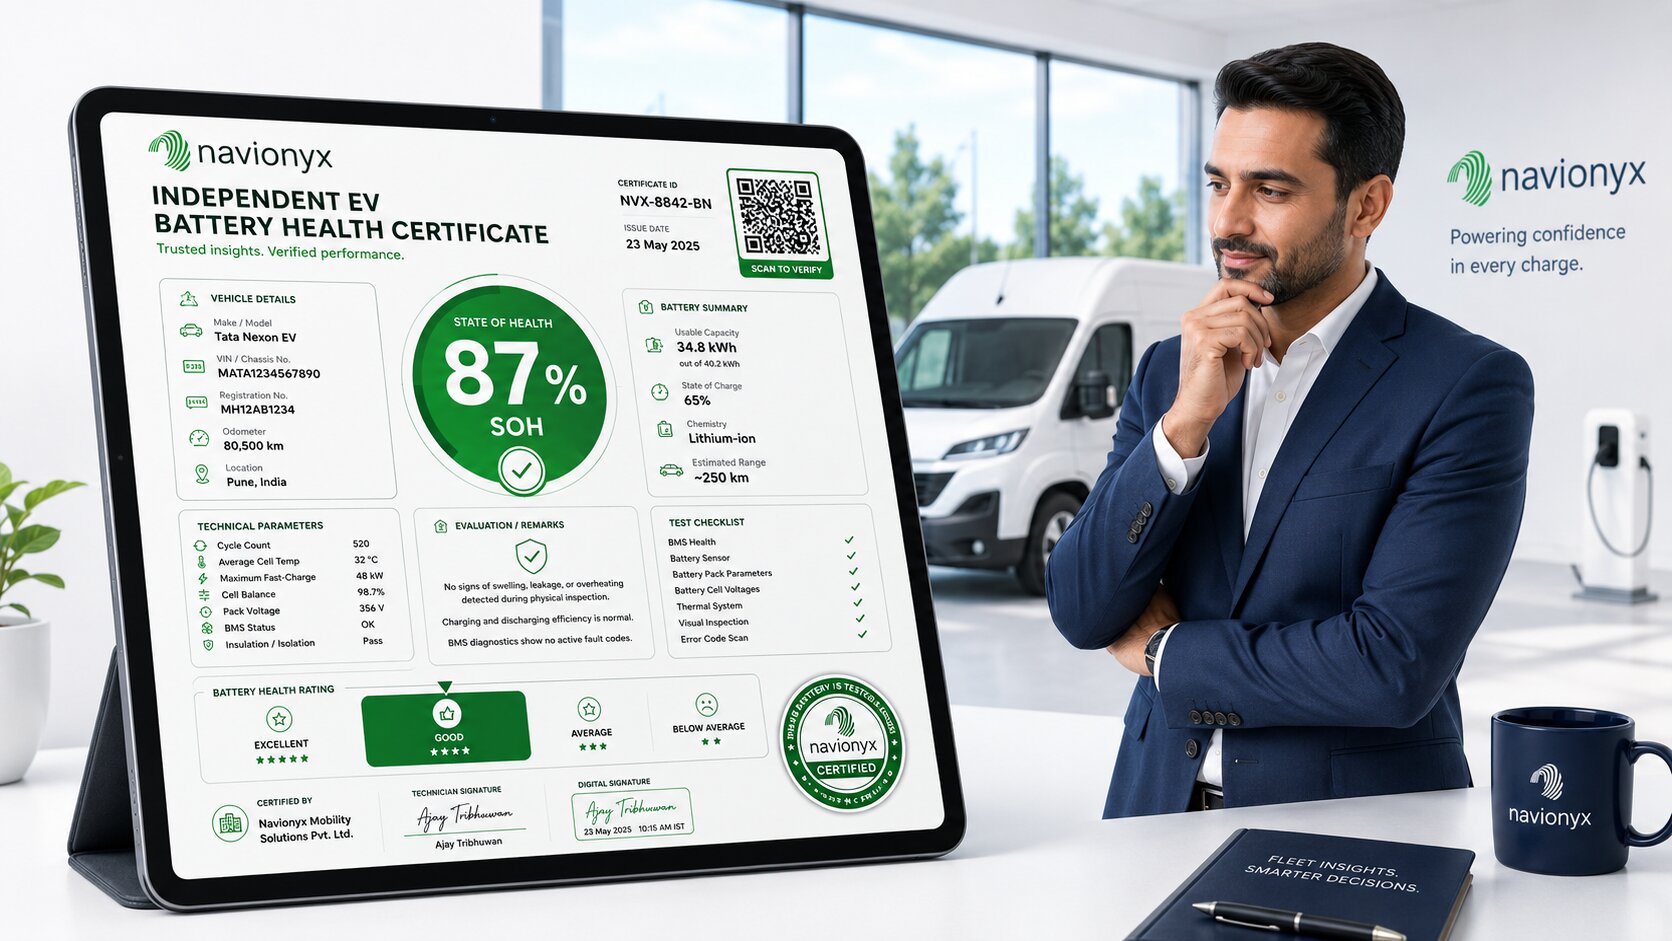
The Data Was There. The Layer Was Missing.
The vehicle at the center of this article did not fail silently. Every session it ran, every charge cycle it completed, every hour its cells held temperature above 36°C — all of it was generating data. The BMS was recording. The 16 cells were sending voltage readings every few seconds. The pack was reporting its thermal load, its capacity, its SOC delta, and its charge session history to anyone equipped to listen. The data was never the problem.
What was missing was the intelligence layer. The layer that translates raw BMS signals into a State of Health trend. The layer that flags a temperature exceedance at 2 PM on a Tuesday before it compounds into permanent capacity loss. The layer that shows a fleet manager the pack-level thermal pattern three months before it becomes a range failure, and gives a lender the documentation they need to defend a residual value at end of lease. That layer is the difference between an EV fleet asset that is managed and one that is simply operated until it stops performing.
India’s EV fleet financing market is expanding fast enough that the gap between market scale and monitoring maturity has become a systemic risk. A projected USD 28.79 billion financing market, built substantially on assets whose primary value driver, the battery, is not continuously tracked or independently verified, is a market carrying risk it has not yet fully priced. The batteries in those fleets are generating signals right now. Most of those signals are not being read.
The solution is not complicated. Certification at origination gives every lease a verified battery baseline. Continuous BMS monitoring through the tenure creates the operational health record. Together they convert the battery from a black-box liability into a documented, auditable, financeable asset that the entire lease chain, the fleet operator, the lender, the insurer, and the eventual buyer, can rely on.
That is the intelligence layer the Indian EV fleet market needs. And it is available today.
Get Your Battery Certified
Establish a verified, QR-backed battery baseline before your next lease origination, resale, or fleet audit event.
Start Certification →Get EV Battery Health Report
A real sample of the report buyers, dealers, and platforms use to verify battery condition before an EV resale transaction.
Get EV Battery Report →Battery and vehicle data referenced in this article are drawn from real vehicles monitored on the Navionyx platform. Vehicle identifiers and operator details have been anonymized for publication. Market statistics and research cited from industry research firms, fleet analytics providers, trade publications, and used EV buying guides, covering the period 2024 to 2026. Temperature and degradation chemistry references drawn from published electrochemical research in ACS Omega, Nature Scientific Reports, and ScienceDirect. This article was produced by the Navionyx team with AI research assistance and reviewed before publication.