When people talk about electric vehicle battery health, one number usually gets the most attention: State of Health, or SoH.
For fleet owners, used EV buyers, financiers, and operators, SoH matters because the battery is one of the most valuable components in any electric vehicle. It directly affects driving range, vehicle uptime, maintenance planning, and resale value.
But there is one major problem.
SoH alone does not always tell the full story.
A battery may show 93% SoH, but that does not automatically mean the vehicle will deliver 93% of its original real-world range in every condition. The actual usable battery performance depends on many more factors: cell voltage, State of Charge, cell balancing, temperature, charging behaviour, discharge behaviour, internal resistance, and the condition of the weakest cell inside the pack.
This is where battery analytics needs to go deeper.
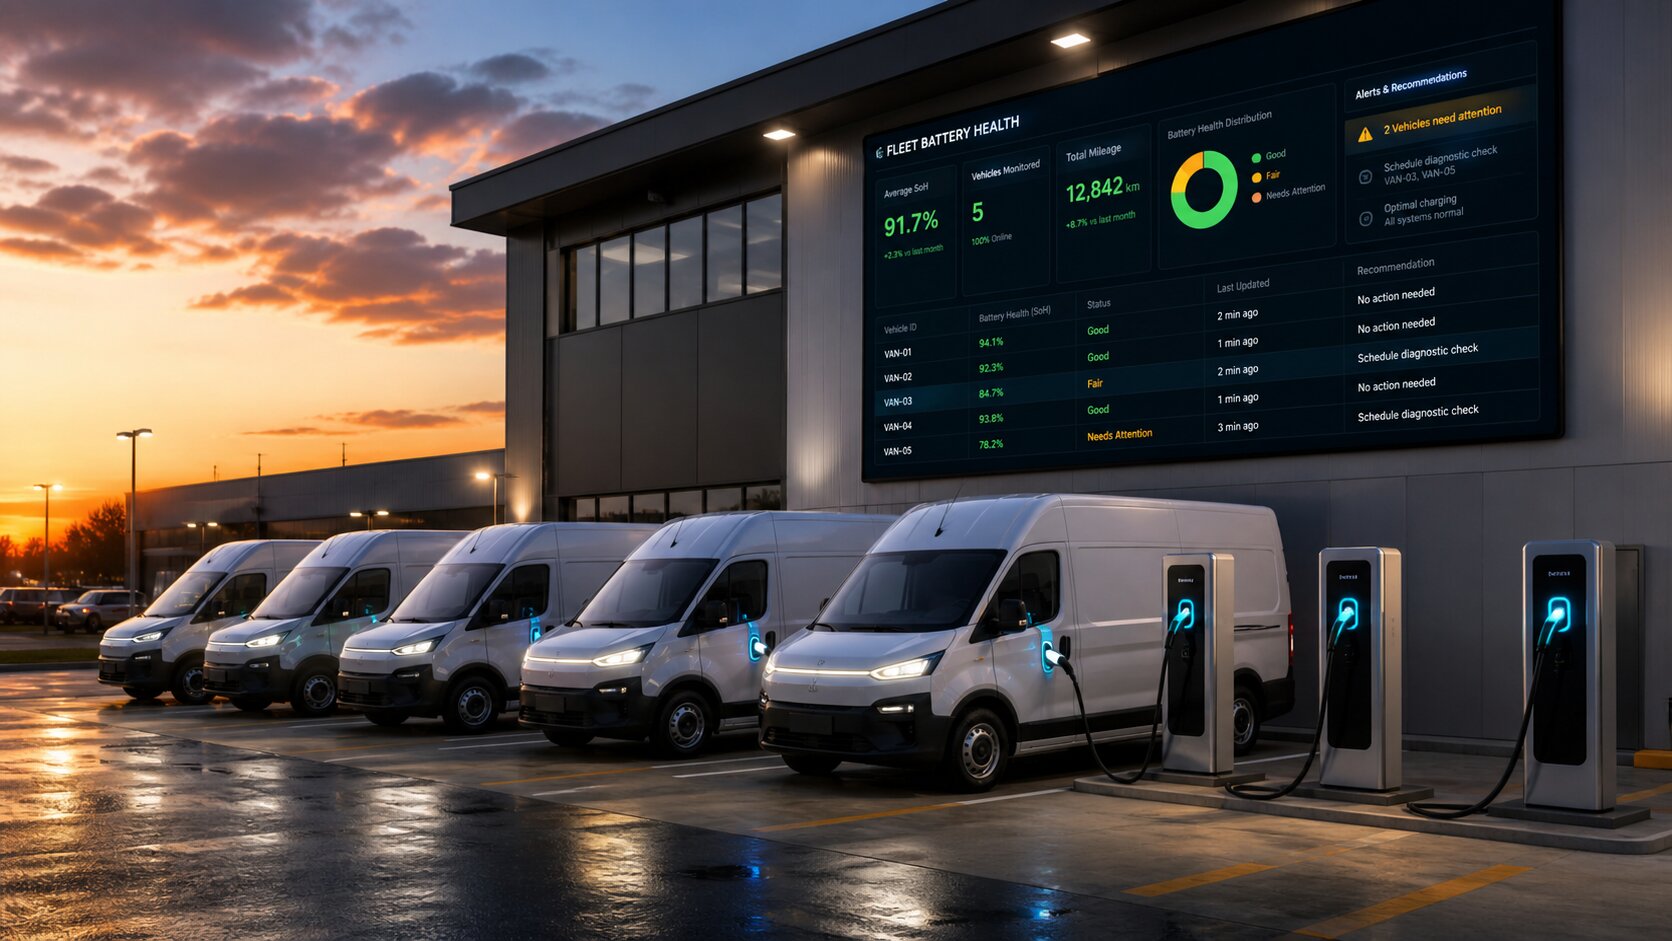
At Navionyx, we look at EV battery health not as a single percentage, but as a live operating system. Through IoT-based telematics and cell-level battery intelligence, Navionyx helps fleet operators monitor battery behaviour continuously — including 16-cell analytics, voltage variation, SoC, SoH, temperature, charging status, and battery alerts — so every decision is grounded in the complete picture.
What Is State of Health (SoH)?
State of Health, or SoH, is a measure of how healthy a battery is compared to its original condition when it was new. It is usually shown as a percentage.
For example:
The battery is close to its original factory condition. Performance and capacity are as expected.
The battery has lost some of its original health. A slight reduction in usable capacity may be noticeable in day-to-day operations.
The battery shows significant degradation. Depending on the vehicle, chemistry, and use case, range impact is likely to affect fleet scheduling and productivity.
However, SoH is not directly measured the way speed or voltage is. It is calculated using battery data and algorithms. Different systems may calculate SoH differently depending on whether they use capacity, usable energy, pack-level values, or cell-level values. This is why two battery diagnostic tools can sometimes report different SoH values for the same vehicle at the same moment.
What Is State of Charge (SoC) — and How Is It Different from SoH?
SoH and SoC are two distinct metrics that are often confused with each other. Understanding both is essential for reading EV battery performance correctly.
Both matter for fleet operations. A vehicle can have a high SoH but a low SoC because it has not been charged. A vehicle can have a full SoC but a declining SoH because the battery has aged. Monitoring both together gives a far more accurate picture of what a vehicle can actually do on any given day.
Why SoH Alone Can Be Misleading
For a fleet owner, the real question is not only:
“What is my battery SoH?”
The better question is:
“How much usable energy does my vehicle actually have — and which cell is limiting it?”
An EV battery pack is not a single battery. It is made up of multiple cells — sometimes 16, sometimes many more — connected together to deliver the required voltage and capacity. In an ideal pack, all cells charge and discharge evenly. But in real-world fleet operations, cells do not always age equally. Some become weaker faster. Some charge less. Some heat more. When this happens, the weakest cell can reduce the usable performance of the entire pack — even while the pack-level SoH still looks acceptable on the dashboard.
“A battery showing 93% SoH does not always mean the fleet owner can use 93% of the original range in real operating conditions. The gap between the reported number and the road reality is where fleet risk lives.”
The Weakest Cell Problem: How One Cell Can Limit the Entire Pack
In battery systems, the weakest cell often decides the usable performance of the entire pack. This is one of the most important concepts for fleet operators to understand — and one that is invisible from a single SoH number.
Imagine a battery pack with 16 cells. Most cells are healthy and performing well. But one cell has lower health or lower available charge than the rest.
During discharge, the Battery Management System (BMS) monitors every cell in real time. When that weak cell reaches its lower voltage safety threshold first, the BMS halts further discharge — even though the remaining 15 cells still carry usable energy. This is done to prevent deep discharge damage and protect the pack. The vehicle stops, the driver experiences a range shortfall, and the fleet operator logs an event that no pack-level SoH reading could have predicted or explained.
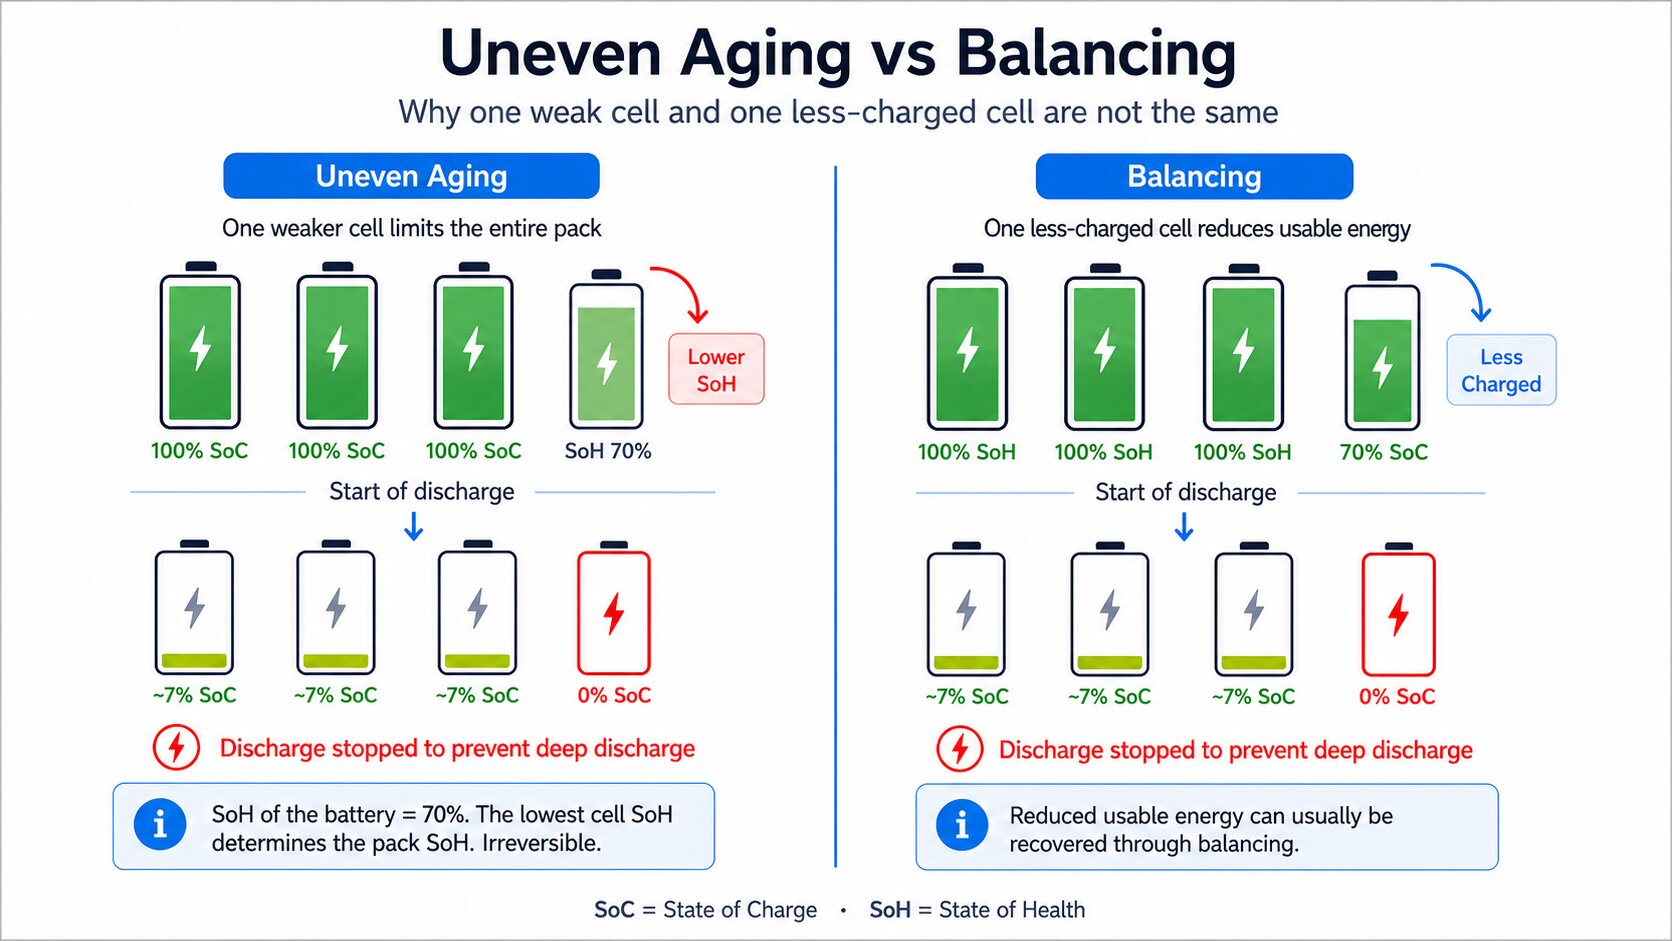
Cell Balancing: The Difference Between a Less Charged Cell and a Weaker Cell
Not all cell imbalance is the same — and understanding the difference is critical for deciding how to respond.
Cell balancing is the process of bringing all cells in a pack closer to the same charge level. When one cell is less charged than the others, balancing can often recover usable energy. The cells are still healthy — just unevenly charged. This is a recoverable situation.
But if one cell has genuinely aged faster and holds lower capacity than its neighbours, balancing alone cannot fully solve the problem. The underlying capacity loss is not reversible, and the cell will continue to limit the pack until it is replaced.
✅ Less Charged Cell (SoC Imbalance)
SoH is equal across all cells. One cell has simply less remaining charge. Balancing can bring cells back into alignment and recover usable range. The underlying health of the battery is intact — the condition is often correctable.
⚠️ Weaker Cell (SoH Imbalance)
The cell has genuinely degraded and holds less capacity than others. Balancing may reduce the visible gap temporarily, but the capacity loss itself is permanent. This cell will continue to limit the pack and the problem will worsen over time.
Without cell-level data, these two situations look identical from the outside. With cell-level analytics, they are immediately distinguishable — and the correct response becomes clear.
Capacity-Based SoH vs Energy-Based Battery Health: What Matters More for Fleets?
Battery health can be measured and understood in more than one way. The method used affects what the resulting number actually tells you — and how useful it is for day-to-day fleet decisions.
Capacity-Based SoH
Measures how much charge the battery can store compared to when it was new, expressed in ampere-hours (Ah). It is widely reported and easy to understand, but may not fully explain real-world range because it does not account for voltage behaviour, temperature effects, or energy delivery under actual load conditions.
Energy-Based Battery Health
Focuses on usable energy, expressed in kilowatt-hours (kWh). For fleet operations, this is often more meaningful because it connects directly to real-world range, operating time, and vehicle productivity. It answers the question that actually matters: how far can this vehicle go today, under real conditions?
For example: if an EV originally delivered 200 km range and now consistently delivers 175 km under similar load and temperature conditions, the fleet operator needs to understand the real usable energy loss — not a theoretical percentage. Energy-based health connects the battery metric directly to the business impact on the ground.
Regulatory Context
UN GTR No. 22 establishes in-vehicle battery durability and performance fade standards for electrified vehicles globally — confirming that battery health has moved from a technical dashboard metric into a formal regulatory and business compliance matter for fleet operators and manufacturers alike.
Cell-Level Analytics: The Real Story Behind EV Battery Health
Pack-level battery data gives a general picture. Cell-level analytics tells the real story.
Most telematics systems collect rich battery data from the BMS, then aggregate it into a handful of summary figures before it reaches the fleet operator. The granular signal gets averaged out. Early warnings get smoothed away before anyone sees them.
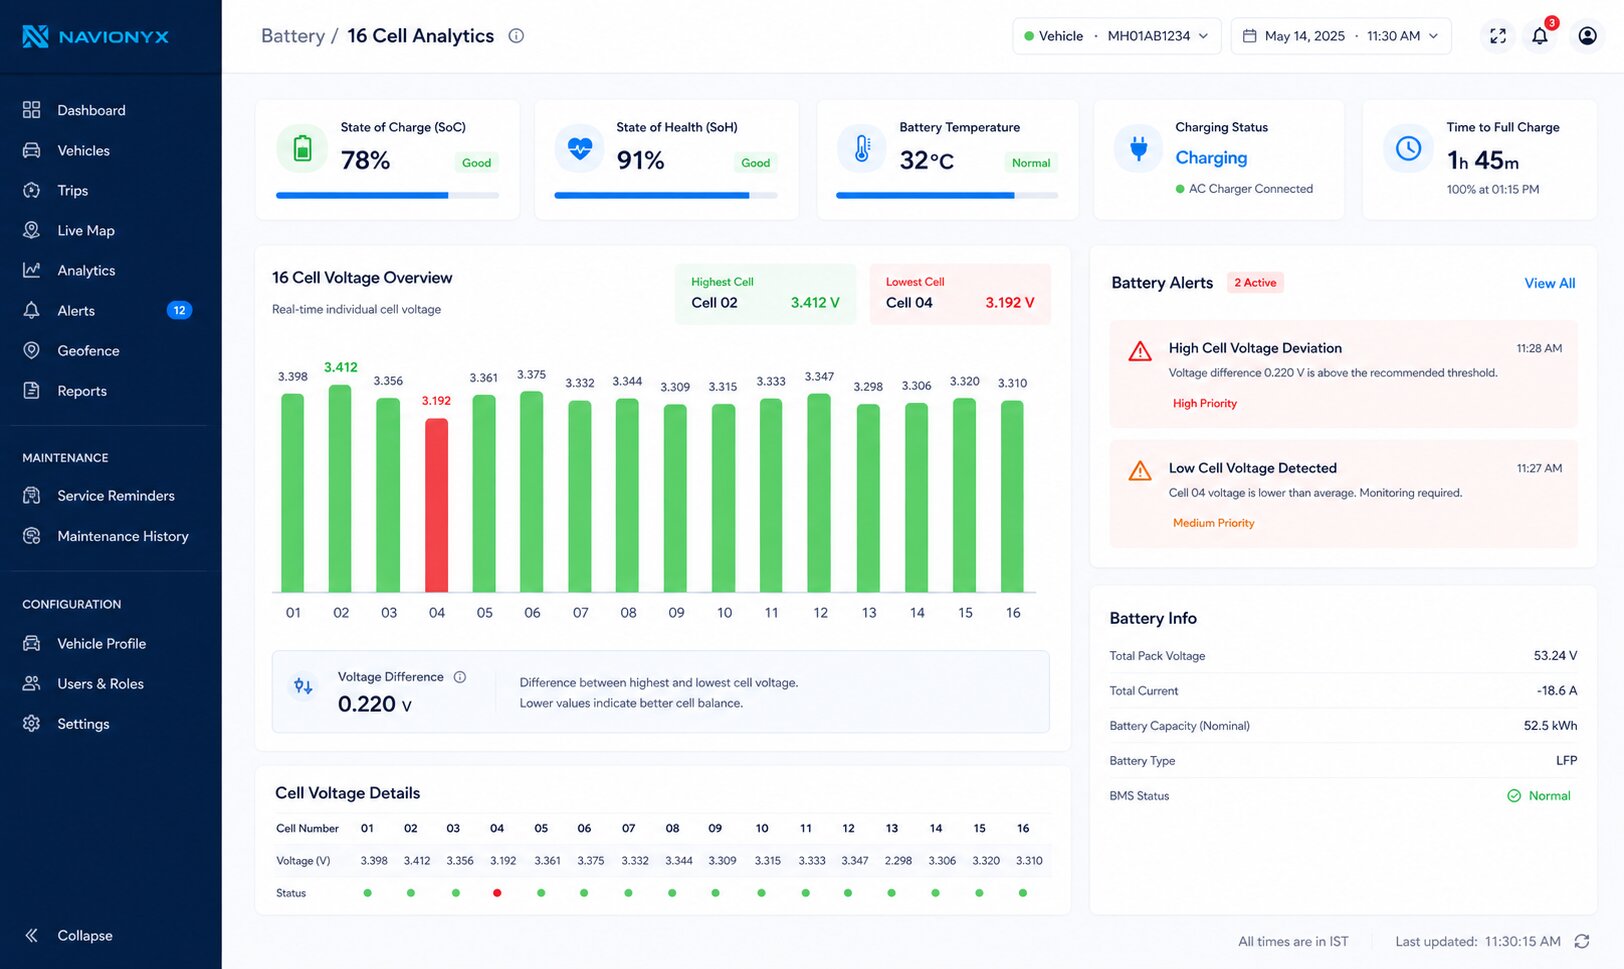
Navionyx is built to surface this granular data and convert it into operational intelligence. For every connected EV in your fleet, Navionyx monitors:
What Navionyx monitors at the cell level:
⚡ All 16 individual cell voltages
📈 Highest and lowest cell voltage
📉 Voltage difference between cells
🔋 State of Charge (SoC)
🩺 State of Health (SoH) trend over time
🌡️ Battery temperature in real time
⚠️ Over-voltage and under-voltage flags
🔄 Charging and discharging status
🚨 Abnormal cell behaviour alerts
📊 Historical degradation trend
This is the difference between knowing that a battery is at 91% SoH — and knowing that Cell 7 of Vehicle 14 has been showing a voltage delta of 42mV across three consecutive charging cycles, is triggering under-voltage flags during high-load discharge, and is degrading at a rate that warrants attention within 60 days.
If one vehicle in the fleet is showing faster range drop than others, Navionyx can help identify whether the cause is cell imbalance, charging behaviour, temperature exposure, driver pattern, or actual battery degradation — and point directly to which vehicle, which cell, and what is changing.
“A fleet operator should not only ask ‘What is my battery SoH?’ They should ask ‘Which cell is limiting my usable range — and is the problem getting worse?'”
Why Continuous IoT Monitoring Is Better Than a One-Time Battery Report
One-time battery testing is useful — especially for vehicle buying, selling, financing, or independent certification. A snapshot of battery condition at a single point in time has real value for transactions and audits.
But for a fleet running vehicles every day, a one-time report has a fundamental limitation: batteries are not static.
Battery health evolves continuously in response to how and when a vehicle is charged, the temperatures it operates in, the loads it carries, the depth of discharge each cycle, and many other factors. A report issued on a Tuesday may tell you very little about what that battery will do on a Friday after a demanding week of city routes in summer heat.
Continuous IoT monitoring changes this entirely. A fleet operator who monitors battery health live can answer the questions that actually drive decisions:
→ Which vehicle battery is degrading faster than the rest of the fleet?
→ Which driver or route is creating more battery stress?
→ Which vehicle is frequently charging poorly or incompletely?
→ Which battery is showing abnormal temperature during real-world operation?
→ Which cell is repeatedly becoming the weak link in a specific vehicle?
→ Which vehicle is at risk of a battery-related downtime in the next 30–60 days?
“A one-time battery report tells you the condition at one point in time. Continuous IoT monitoring tells you how the battery behaves every day — while charging, discharging, idling, operating under load, and running across different temperature conditions. One gives you a certificate. The other gives you control.”
Battery Health Is a Business Metric, Not Just a Technical One
For EV fleet operators, battery health directly affects operational and financial outcomes. Poor battery visibility leads to unexpected downtime, lower-than-expected range, charging delays, higher maintenance costs, and warranty disputes. Strong battery analytics changes that picture entirely.
Better Range Planning
Understand the real usable range of each vehicle — not the manufacturer estimate — so dispatch and routing decisions are made on accurate, live data.
Early Issue Detection
Catch cell anomalies and degradation trends weeks before they become failures, range complaints, or roadside breakdowns.
Smarter Charging Discipline
Identify which drivers and routes produce harmful charging patterns — frequent fast charging, deep discharges, high-temperature charging — and act before damage accumulates.
Reduced Downtime
Proactive maintenance replaces reactive breakdown response. Battery service intervals become predictable, not disruptive.
Resale and Residual Value
A continuous record of battery health is a documented service history that supports higher resale valuations and gives buyers confidence no single-point certificate can match.
Fleet-Level Comparison
Compare battery health across your entire fleet to identify outliers and trace root causes back to usage patterns, routes, or charging behaviour.
How Navionyx Delivers Cell-Level Battery Intelligence
Understanding the theory of cell-level battery health is one thing. Turning it into something a fleet team can actually use every day — without becoming battery engineers — is another. This is what Navionyx is built for. Here is how it works in practice.
Step 1 · Connect
IoT device captures live battery data from every connected EV
Navionyx connects directly to the vehicle’s CAN bus and Battery Management System through an in-vehicle IoT device. Cell voltages, pack temperature, charging status, current draw, SoC, SoH, and fault flags are streamed continuously to the Navionyx cloud — not sampled once a day, but captured at operational frequency.
Step 2 · Analyse
Cell-level data is translated into operational intelligence
Raw BMS data is processed against historical baselines for that specific vehicle and the fleet as a whole. Navionyx identifies voltage deltas between cells, charging anomalies, temperature stress events, abnormal discharge patterns, and slow-developing degradation trends. The system distinguishes between recoverable SoC imbalance and true SoH degradation — so the response can match the actual problem.
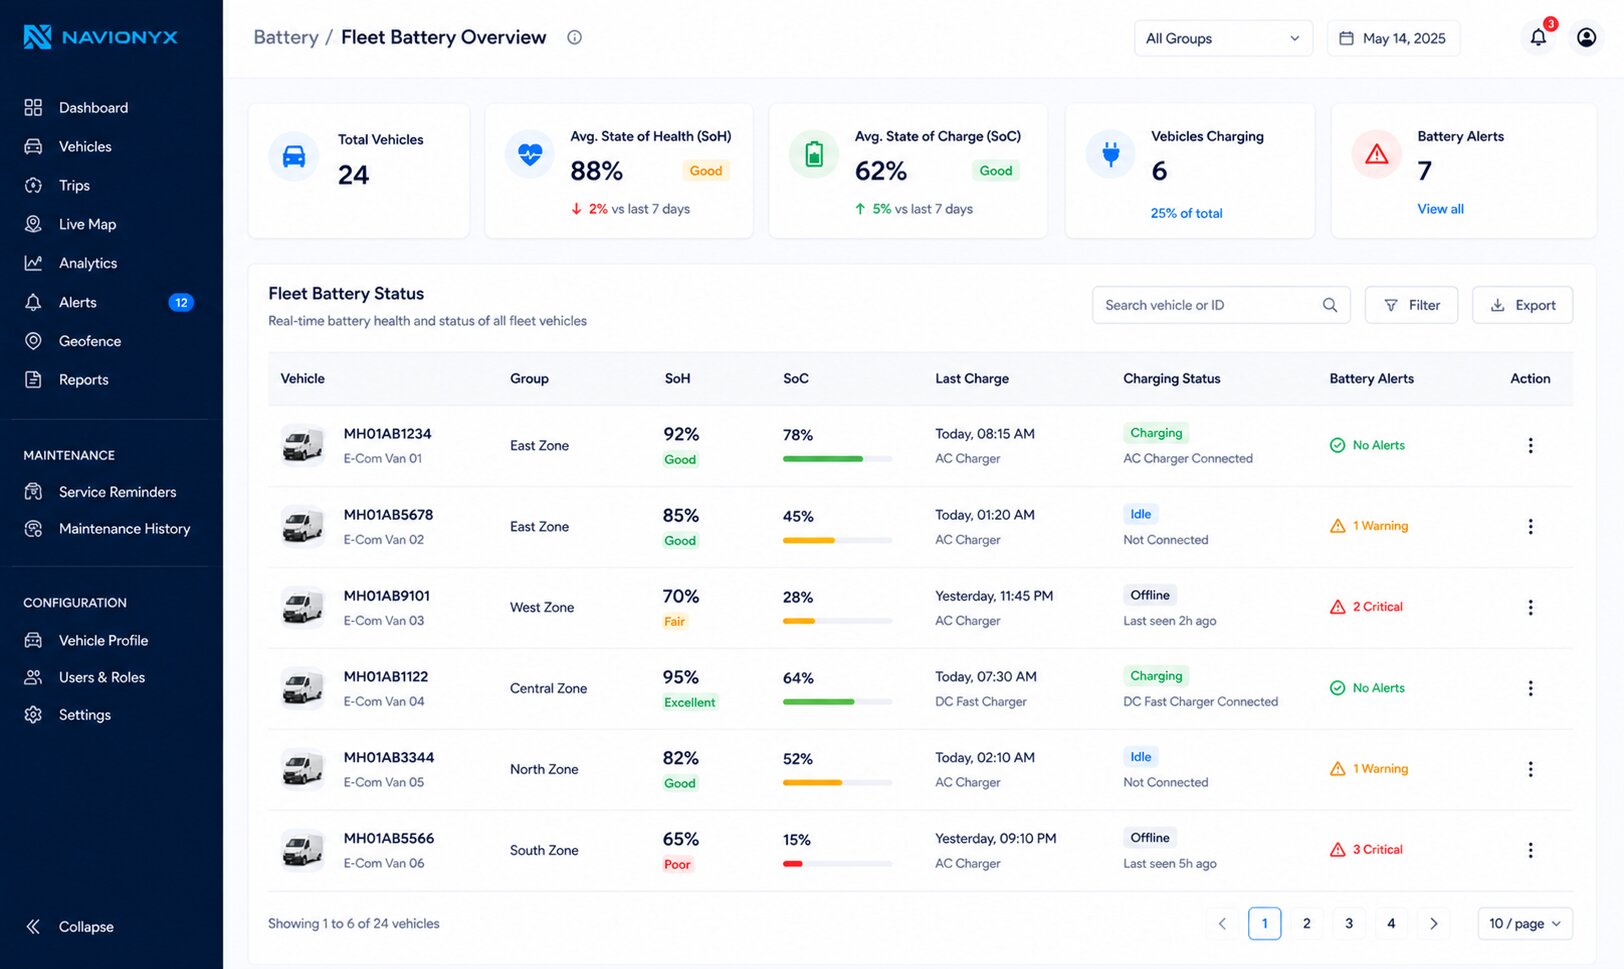
Step 3 · Visualise
Fleet operators see the full picture in one dashboard
The Navionyx dashboard surfaces battery intelligence at three levels: fleet view (compare battery health across all EVs at a glance), vehicle view (drill into a single vehicle’s SoC, SoH, range, charging history, and trends), and cell view (inspect individual cell voltages, voltage deltas, and any flagged abnormal cells). No battery engineering background required — the data is presented in fleet-operations language, not lab terminology.
Step 4 · Act
Alerts and reports trigger the right action at the right time
When a battery, cell, or charging pattern crosses a defined threshold, Navionyx pushes an alert to the fleet team — not just a passive flag on a dashboard. Maintenance teams get vehicle-specific notifications. Operations get range-impact warnings before dispatch. Management gets fleet-wide degradation reports for planning and procurement. Battery intelligence becomes a workflow, not a screen to remember to check.
The result is a fleet that sees battery problems before they become breakdowns, plans range and routes on real data instead of manufacturer estimates, and builds a documented service history that protects warranty claims and resale value.
From SoH to Real Battery Intelligence: How Navionyx Helps Fleet Operators
The EV industry is moving beyond basic tracking. For many years, fleet telematics meant knowing where a vehicle is located. For EV fleets today, that is no longer enough.
Navionyx provides IoT-based EV telematics and fleet intelligence designed for real-world operations. Through connected vehicle data, fleet owners can monitor live and historical battery behaviour — and answer the questions that actually drive decisions:
✦ Which vehicle has the healthiest battery in the fleet right now?
✦ Which battery is losing usable range week over week?
✦ Which cell is creating imbalance in a specific vehicle?
✦ Which vehicle needs inspection before it becomes a breakdown?
✦ Which charging pattern is quietly shortening battery life?
✦ Which vehicle is safe for a long-distance assignment tomorrow?
This is especially important for electric commercial vehicles, logistics fleets, school transport, taxi fleets, rental EVs, and enterprise EV operations — where battery reliability is not just a performance issue but a direct operational and financial commitment.
The Navionyx Difference
At Navionyx, we do not look at EV battery health as a single percentage. We monitor the live behaviour of every connected battery pack — cell by cell, charge cycle by charge cycle, day by day — so fleet operators can make decisions grounded in the complete picture, not just the headline number.
Conclusion
State of Health is important. But it is only the starting point.
A single SoH percentage cannot explain everything about EV battery performance. Real battery health depends on usable energy, cell balance, temperature, charging behaviour, discharge patterns, and the condition of the weakest cell inside the pack. For fleet operators, this difference is not theoretical — it shows up as reduced range, unexpected downtime, missed deliveries, and lost productivity.
Because one weak cell can reduce range. One poor charging habit can accelerate degradation. One unnoticed battery issue can create unplanned downtime. And one missing insight can affect the entire operation.
With Navionyx IoT-based battery analytics, fleet operators can move beyond basic SoH and see the real condition of their EV batteries through live, cell-level, actionable intelligence.
EV battery health is not just a number. It is a complete operating picture.
Ready to See the Full Picture?
Discover How Navionyx Battery Analytics Can Protect and Optimise Your EV Fleet
Join fleet operators who have replaced guesswork with real-time, cell-level battery intelligence. Book a free personalised demo and see your fleet’s battery health in a whole new way.
Book a Free Demo →