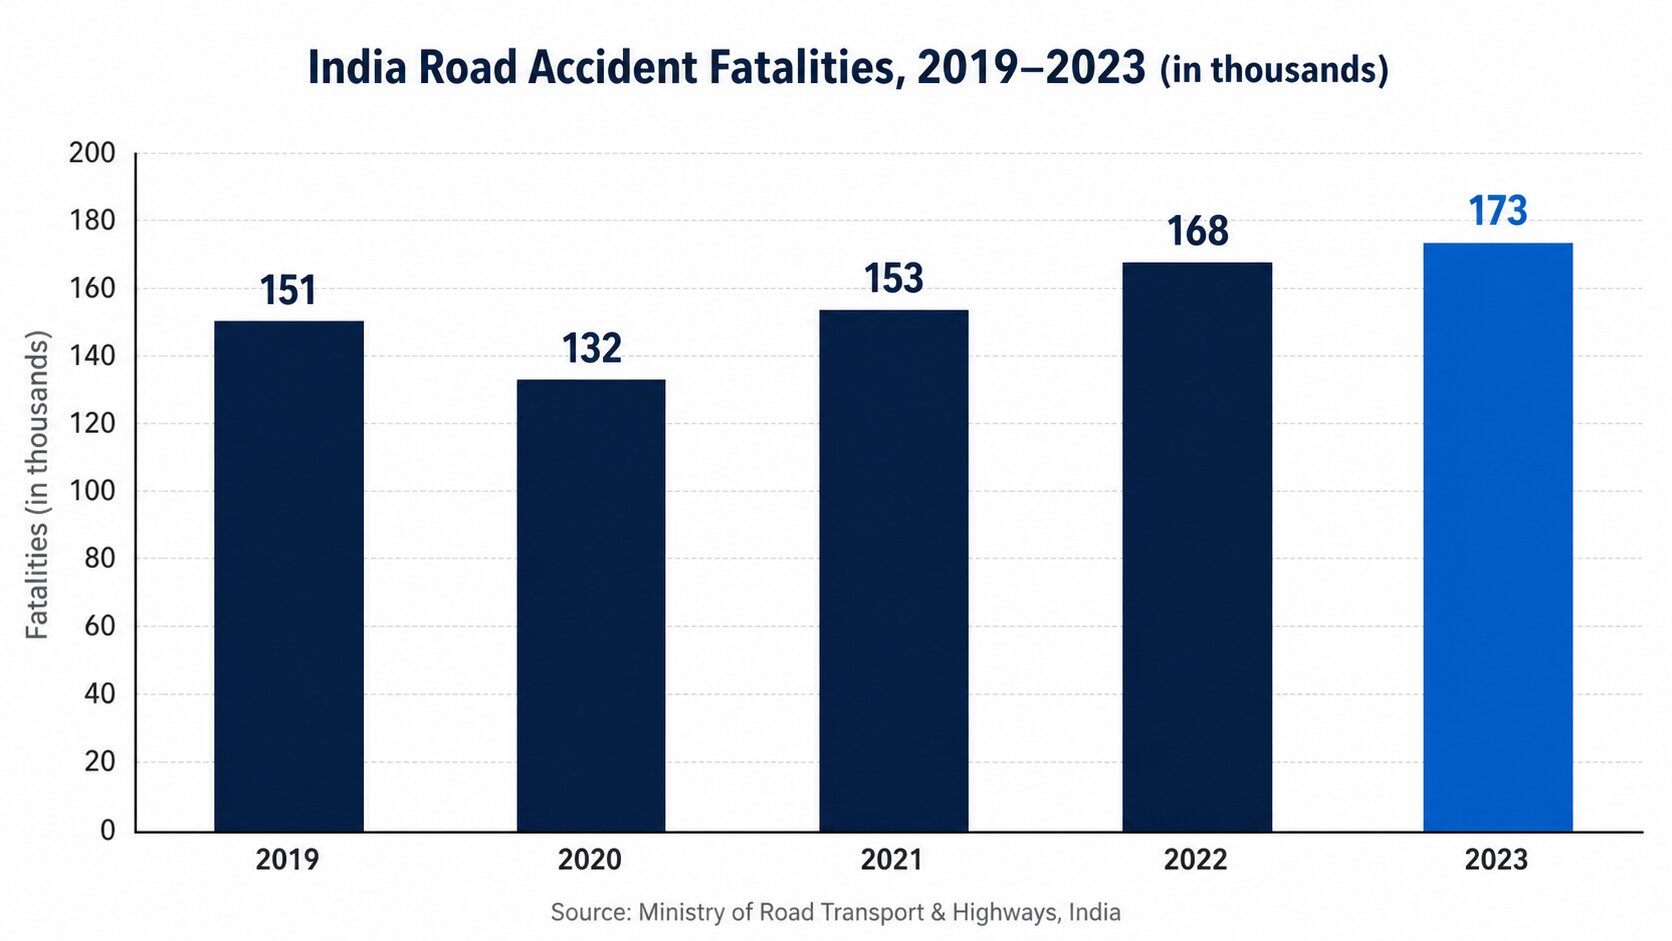
Every hour in India, road accidents kill 20 people and injure 53 more. In 2023 alone, the country recorded 480,583 road accidents resulting in 172,890 deaths — the highest figure ever recorded, according to the Ministry of Road Transport and Highways.[1]
Globally, the picture is no less sobering. Lytx analyzed 300 billion miles of commercial driving data and found low-severity fleet collisions surged 16% in 2025, while the construction sector alone saw a 28% year-over-year spike.[2] The average commercial fleet still runs an annual accident rate near 20%.[3]
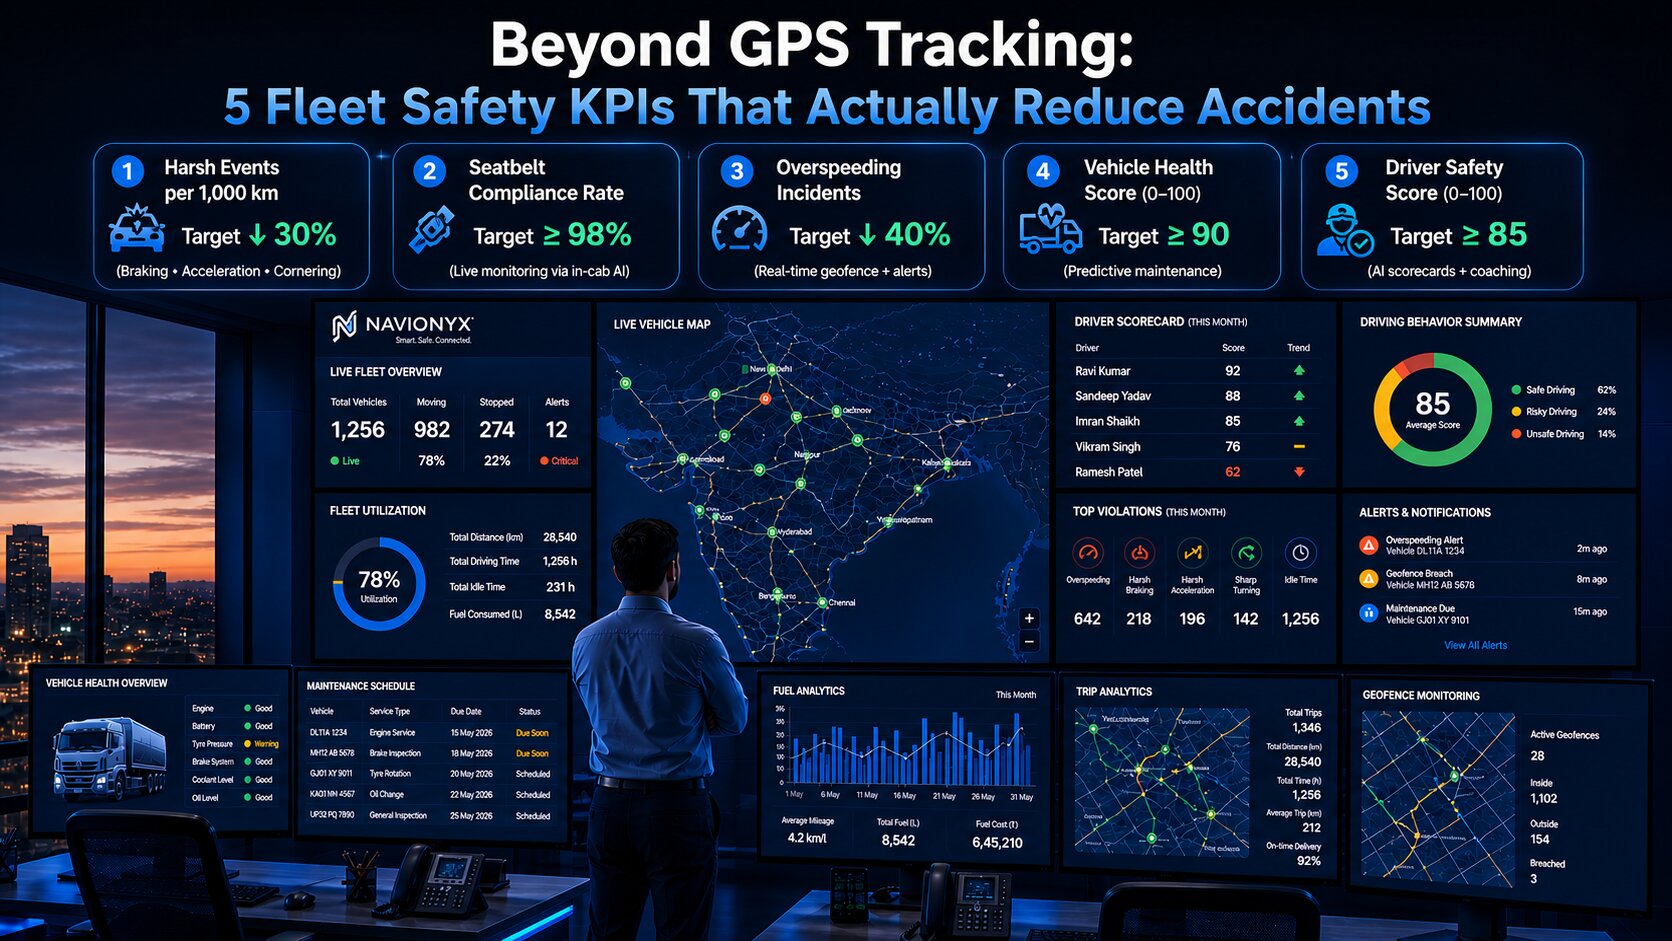
Here is the uncomfortable truth most fleet operators avoid: GPS tracking alone has stopped being enough. A vehicle’s location tells you where it is. It does not tell you how it is being driven, whether the brakes will fail next Tuesday, or which driver is three near-misses away from a costly collision. The fleets pulling ahead in 2026 are not the ones with the most expensive hardware. They are the ones measuring the right KPIs — and acting on them.
“In modern fleet safety, what gets measured gets managed. The right risk metrics let managers spot adverse trends and act decisively — before they become claims.”
The Indian Context: Why These KPIs Matter Here, Now
Before diving into the metrics, it is worth understanding why fleet safety in India is a uniquely high-stakes problem — and a uniquely large opportunity.
The numbers tell a sharp story
India Road Accidents 2023 — Key Findings (MoRTH):[1]
• 480,583 accidents, up 4.2% year-on-year
• 172,890 deaths — the highest ever recorded
• Overspeeding caused 68% of all fatalities — the single biggest controllable cause
• Highways = 5% of road network but 53% of accidents and 59% of fatalities
• 18-45 age group = two-thirds of all victims (working-age population)
The regulatory shift: AIS-140 changes the math
Since August 2022, India’s AIS-140 mandate has required all N2/N3 commercial vehicles, hazardous goods carriers, and public transport vehicles to install certified GPS tracking devices, panic buttons, and accelerometers capable of detecting harsh braking and acceleration.[4] Non-compliance can mean permit suspension, heavy fines, and ineligibility for insurance claims.
The implication is huge. Indian fleets already have the hardware mandated by law. The question is no longer “should we adopt telematics?” — it is “are we using the data, or just complying with the regulation?” The fleets converting AIS-140 data into actionable KPIs are the ones cutting accidents, premiums, and downtime. The rest are paying for compliance without earning the dividend.
With that context set, here are the five KPIs that actually move the needle.
KPI 1: Collision Rate Per 100,000 Miles
What it measures: The number of collisions normalized against distance driven. The industry-standard formula is collisions per 100,000 miles (or kilometres) — not per vehicle. Normalization is what lets a 20-vehicle fleet benchmark fairly against a 2,000-vehicle one.
Why it matters: Every collision triggers a cascade of cost — repair bills, downtime, insurance premium hikes, civil liability exposure, and brand damage. Geotab pegs a “good” near-miss benchmark at fewer than 5 per 1,000 miles, but the lagging indicator that proves your safety program works is collision rate trending downward, quarter over quarter.[5]
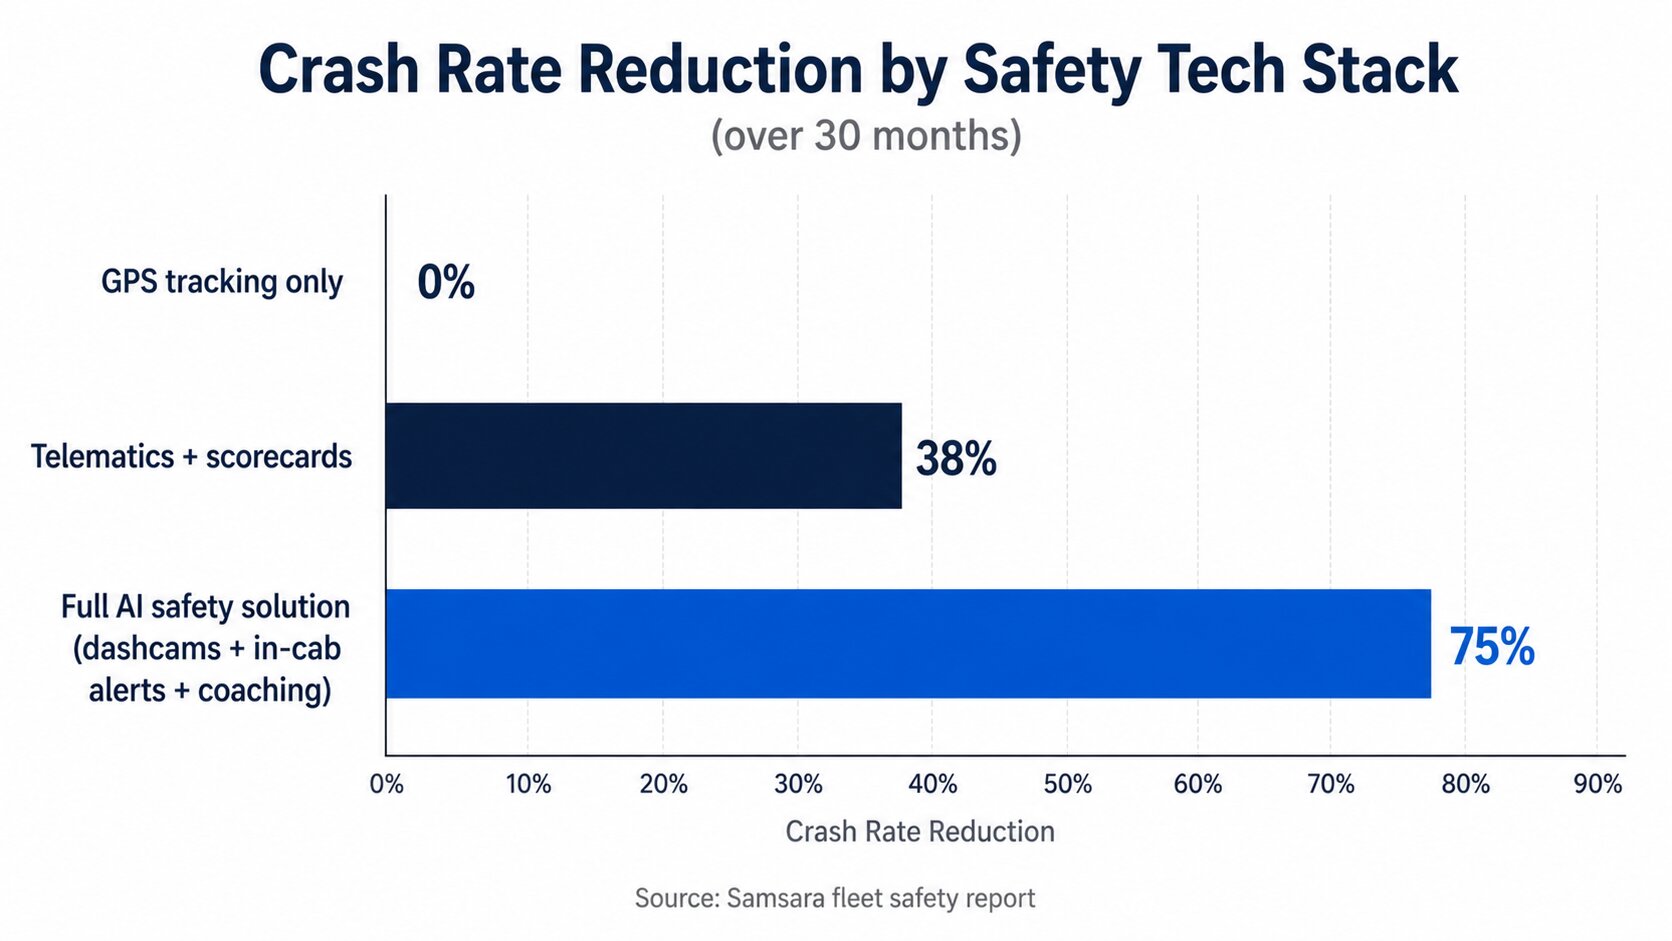
The data: Samsara customers with full AI safety solutions — including dual-facing dash cams, in-cab alerts, and AI coaching — recorded a ~75% decrease in crash rate over 30 months.[6] Geotab’s risk analytics alone delivered a 5.5% reduction in predicted collisions, with one fleet cutting speeding in target zones by 76% in three months.[5]
How Navionyx helps: AI dashcams flag risk events the moment they happen. Severity scoring, video evidence, and root-cause analysis turn each incident into a coaching opportunity — so the same mistake does not happen twice.
KPI 2: Driver Compliance Score
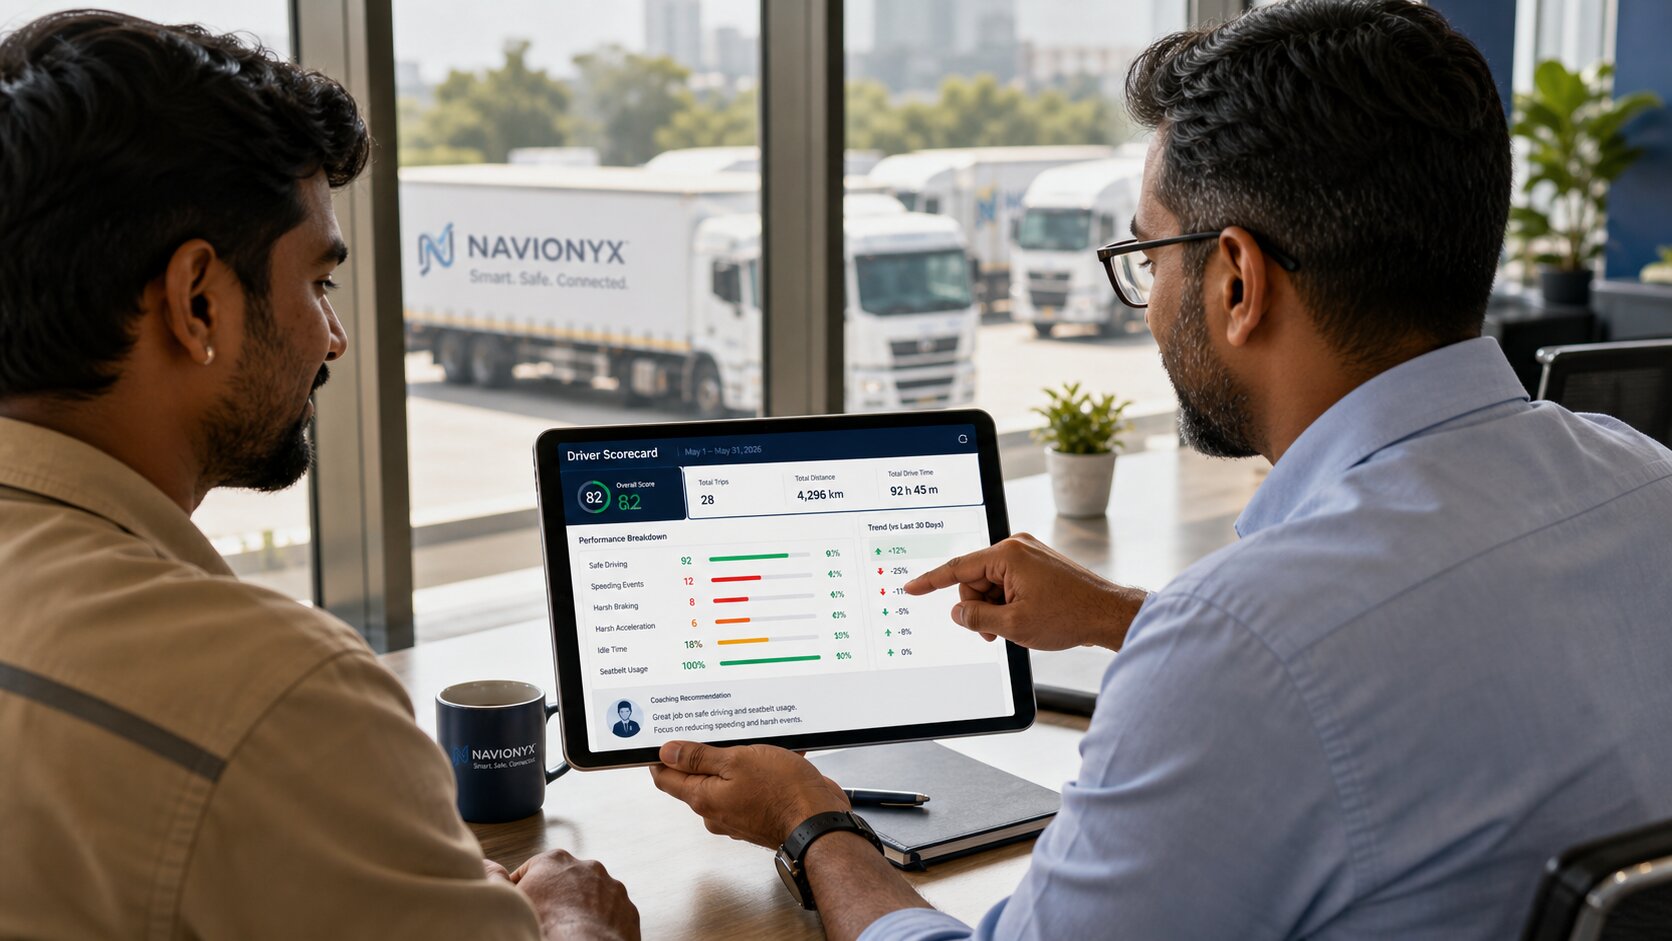
What it measures: A composite score per driver — usually 0 to 100 — blending speeding, harsh braking, harsh acceleration, harsh cornering, idle time, and seatbelt usage into a single number that managers can rank and coach against.
Why it matters: Driver behavior is the single largest controllable variable in fleet safety. You cannot control monsoons, traffic, or road quality. You can control how your drivers respond to them. In India, the case for this KPI is overwhelming — overspeeding alone causes 68% of all road fatalities.[1] A telematics-driven compliance program directly attacks the country’s #1 killer on the road.
The data: A landmark study found that pairing in-vehicle monitoring with structured coaching reduced risky driving behavior by up to 86% compared to monitoring alone.[7] Recent University of California, San Diego research (2025) confirmed that personalized, feedback-driven coaching produces deeper, longer-lasting behavior change than classroom training.[8]
How Navionyx helps: Each driver gets an objective scorecard updated in real time. Managers can target coaching at the riskiest 20% of drivers first, reward consistent performers visibly, and turn compliance from a top-down mandate into a culture of accountability.
KPI 3: Vehicle Maintenance Index (Predictive Health Score)
What it measures: A live health score per vehicle, synthesized from engine diagnostics, sensor data, driving behavior patterns, and service history. The shift is from scheduled maintenance to condition-based maintenance — fixing what is actually wearing out, when it is wearing out.
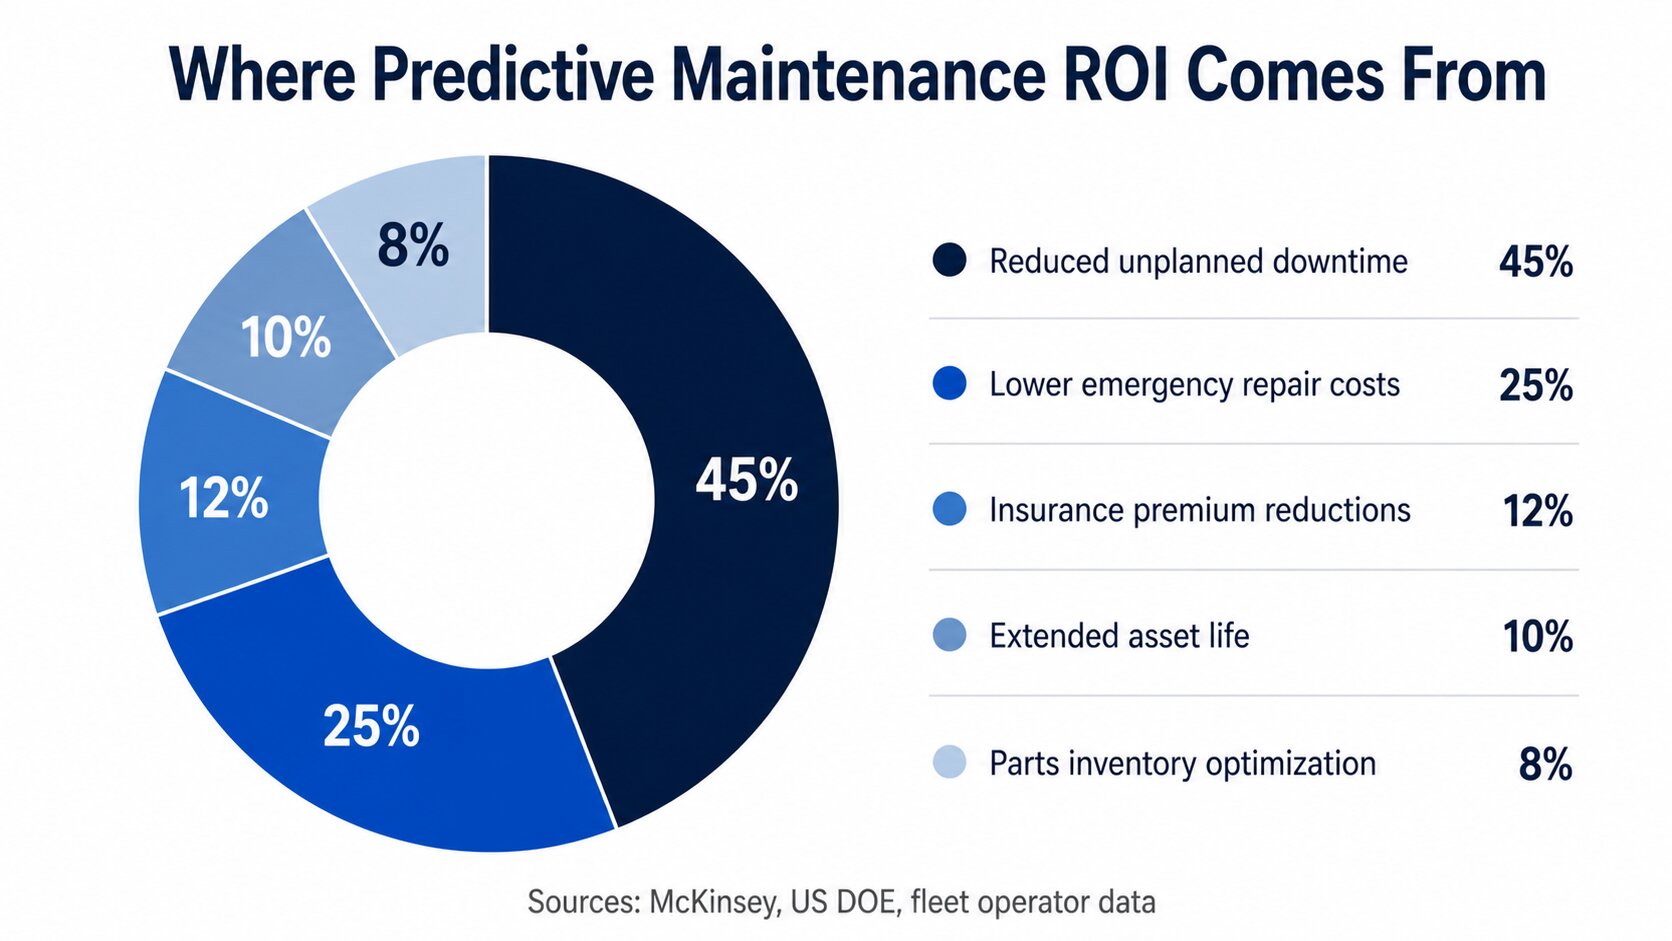
Why it matters: Maintenance now accounts for 27% of total fleet lifecycle costs — the highest share in a decade — yet only 27% of fleets globally actually use predictive maintenance.[9] That gap is where the savings hide. Brake failures, tire blowouts, and engine breakdowns cause both direct accidents and indirect ones (the truck swerving to avoid your stalled colleague’s vehicle).
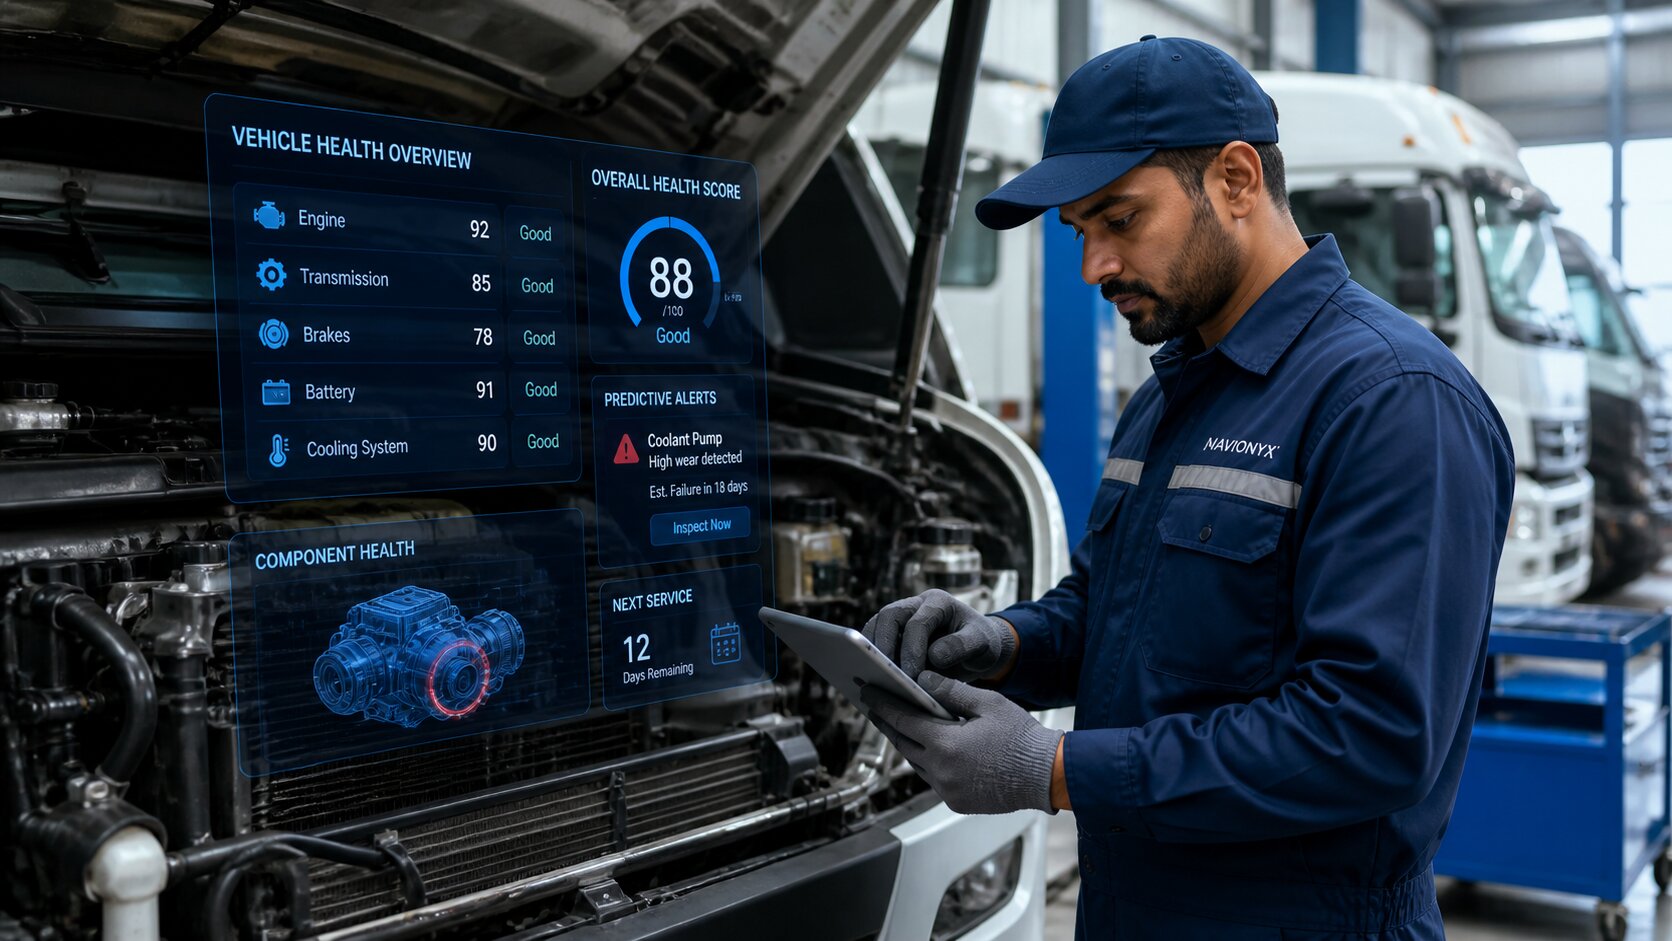
The data: Predictive maintenance delivers a 30% reduction in maintenance costs and prevents up to 75% of unscheduled failures, with payback typically achieved in 12-18 months.[10] Coca-Cola Consolidated extended its Mean Time Between Failures from 4.5 days to 28 days (a 522% improvement) using condition-based monitoring.[10] Insurers in major markets now offer 8-15% premium reductions for fleets with certified AI maintenance programs.
How Navionyx helps: Telematics + driving-behavior data flag overused vehicles, detect aggressive driving patterns that accelerate wear, and trigger preventive work orders before a roadside breakdown happens. The shift is reactive maintenance → predictive maintenance — and the ROI shows up in the first quarter.
KPI 4: Telematics Data Utilization Rate
What it measures: The percentage of collected telematics data your operation actually uses to make decisions — not just store. Most fleets capture hundreds of data points per vehicle per minute. Few act on more than a handful.
Why it matters: Unused data is pure overhead. Every idle minute, sub-optimal route, and weather-blind dispatch decision is a measurable cost. The Federal Highway Administration reports that 21% of all crashes involve adverse weather — yet most fleets still dispatch routes without integrating real-time weather data.[2] In India specifically, where 5% of roads (highways) carry 53% of accidents,[1] route-level risk intelligence is not a luxury — it is where the math lives.
The data: Fleets that fully operationalize their telematics see 3:1 to 6:1 ROI within the first year, with most recouping their investment within 12 months.[5] The global fleet management market is projected to reach $35 billion by 2030 — and the operators that win that race will be the ones treating data as a decision engine, not a storage cost.
How Navionyx helps: Raw telematics streams are converted into route optimization recommendations, idle-time reports, fuel-waste alerts, and ESG-ready emissions analytics — in dashboards designed for action, not admiration.
KPI 5: Safety Training Effectiveness
What it measures: The delta in driver safety scores, incident frequency, and coachable events before vs. after training intervention. Training without measurement is just an expense.
Why it matters: Most fleets run a once-a-year classroom session, check the compliance box, and call it a program. The evidence is overwhelming that this approach barely moves outcomes. Continuous, behavior-specific coaching does.
The data: Comprehensive driver training programs are linked to 45% fewer accidents and 20% lower maintenance costs.[11] Modern e-learning platforms deliver 60% better knowledge retention with 40% less training time, and gamified safety programs lift engagement by 85%.[11]
How Navionyx helps: Pre- and post-coaching scorecards make training ROI visible. Drivers who repeat unsafe behaviors trigger automated micro-training assignments. Real-time in-cab feedback turns every trip into a coaching session — quietly, continuously, and without manager bandwidth becoming the bottleneck.
The Hidden Layer: Liability Protection & Theft Prevention
The five KPIs above prevent incidents. Two more capabilities protect you when something does go wrong.
Accident liability protection. In a collision, falsified or missing records dramatically increase legal exposure. Video telematics — timestamped and tamper-resistant — provides definitive evidence that exonerates innocent drivers, defeats fraudulent claims, and accelerates settlements. Most fleets see fully-loaded insurance costs drop within the first renewal cycle.
Theft and vandalism deterrence. Visible dash cams change behavior on both sides of the windshield. When incidents do occur, footage cuts the time from theft to suspect identification by hours, often days.
From Tracking to Intelligence: The Cultural Shift
KPIs only matter when they change behavior. The fleets pulling ahead in 2026 have made safety visible, measurable, and shared.
That looks like: weekly leaderboards drivers actually check, monthly reviews where the riskiest 10% get coaching first, quarterly goal-setting where insurance premium reductions are tied directly to scorecard improvements, and recognition programs that reward the safest 10% as visibly as sales targets reward top performers.
“Safer fleets are not the ones with the most cameras. They are the ones where every driver knows their score, every manager knows their high-risk list, and every decision is informed by data the team trusts.”
Why Navionyx
Navionyx is built around the premise that fleets do not need more data — they need better decisions. Every feature on the platform exists to convert raw signal into intervention:
Real-time GPS with actionable alerts. AI-powered video telematics. Automated driver scorecards. Predictive maintenance flags driven by behavior + sensor fusion. Route optimization integrating traffic, weather, and fuel cost in one logic. Instant SOS, geofence, idle, and overspeed alerts. AIS-140 compliance built in.
It is not a tracking platform. It is a decision system for operations leaders who refuse to manage their fleet by guesswork.
Final Thoughts
Fleet safety is not a feeling. It is a number — five of them, in fact — measured continuously, acted on consistently, and improved deliberately.
The operators winning in 2026 have stopped asking “Where are my vehicles?” and started asking “Which of my drivers, vehicles, and routes carry the most risk this week — and what am I doing about it?” That single shift, from location to intelligence, separates a fleet that survives the next insurance renewal cycle from one that thrives in it.
Ready to manage your fleet by intelligence, not location?
See how Navionyx turns these five KPIs into a single dashboard your team will actually use.
Book a Free Demo →Sources & Further Reading
Additional reading: IIT Delhi TRIP Centre, India Status Report on Road Safety 2024 — tripc.iitd.ac.in